-Financial Tools Futures Market--TRADE IDEAS-- OPTION ALERTS -BENZINGA PRO-

Wednesday, April 18, 2012 

Four Breakout Stocks To Watch on Thursday

 ( click to enlarge )

The Gap Inc. (NYSE:GPS) stock embarked on another leg of the bull rally that took it to a new high of $27.66 today on rising volumes. Technical indicators are supporting the bulls. The stock is still on a strong bull market with 50-day moving average on top over 200-day moving average and MACD is above signal line. Today’s high was $27.66, which is resistance for the continuation move on Thursday.  If you haven't added GPS to your watchlist, now is the time.

 ( click to enlarge )

Verisign, Inc. (NASDAQ:VRSN) continues to show strength as the rise in volume confirms the price uptick. This stock is clearly in an impulsive wave upwards. If you are on board, there is nothing more to do but enjoy the ride.

  ( click to enlarge )

Tibco Software Inc. (NASDAQ:TIBX) Nice break on strong volume, like the OBV trend, RSI has space to move up more.

  ( click to enlarge )
 
Family Dollar Stores, Inc. (NYSE:FDO) had a huge breakout day on heavy volume. The stock hit a high of $67.15, which is now resistance for Thursday’s continuation move. If the stock can break through resistance, we should see another strong upside move. FDO will move very quickly, so watch the stock closely tomorrow.
 
During the day I tweet many times to my readers. I encourage everybody to subscribe AC Investor Blog  twitter and newsletter, so you can receive my trade ideas and stock news in real time. 

Disclaimer : This is not an investment advisory, and should not be used to make investment decisions. Information in AC Investor Blog is often opinionated and should be considered for information purposes only. No stock exchange anywhere has approved or disapproved of the information contained herein. There is no express or implied solicitation to buy or sell securities. The charts provided here are not meant for investment purposes and only serve as technical examples. Don't consider buying or selling any stock without conducting your own due diligence.

Thanks for visiting AC Investor Blog.

AC

Labels: , , ,

Bookmark and Share

Tuesday, April 17, 2012 

Stocks on Watch for the 18th of April

( click to enlarge )

Congrats everyone who bought this stock when I put out an alert on it. Sequenom, Inc. (NASDAQ:SQNM) has gained more than 30% value in the last five sessions, but don't think for a second that SQNM is finished it's just getting started ! From a technical stand point the stock has reversed the downward trend with MACD back above 0 and stock trading above 50 day moving average. In addition, KD also indicate positive momentum. OBV confirmed trend reversals. The stock is not yet overbought and there is room for a move up to 5 (but there may be resistance around 4.77). Insiders are also very bullish about the company and have been buying shares in the last six-months. Recent surge may spur profit taking but for the medium term the technical is looking good.

 ( click to enlarge )

Pacific Ethanol Inc (NASDAQ:PEIX) Needs to hold the 200 DMA (0.85) now and recover to keep us in the play. Short term indicators are in favor of bears.

 ( click to enlarge )

Ciena Corporation (NASDAQ:CIEN) Technical chart looks pretty good as the golden cross has formed early March, RSI is around 60 and MACD is above 0. I believe the stock is setting up to break out and has one more level to go, which is $17.39.

 ( click to enlarge )

Verisign, Inc. (NASDAQ:VRSN) had a strong move today, as the stock set new 52-week highs. The stock hit a high of $42.07, which is resistance for the follow through move. The long term trend is bullish as the stock is above 50-day and 200-day moving averages with both moving averages going up. You should watch this stock closely on Wednesday.

During the day I tweet many times to my readers. I encourage everybody to subscribe AC Investor Blog  twitter and newsletter, so you can receive my trade ideas and stock news in real time. 

Disclaimer : This is not an investment advisory, and should not be used to make investment decisions. Information in AC Investor Blog is often opinionated and should be considered for information purposes only. No stock exchange anywhere has approved or disapproved of the information contained herein. There is no express or implied solicitation to buy or sell securities. The charts provided here are not meant for investment purposes and only serve as technical examples. Don't consider buying or selling any stock without conducting your own due diligence.

Thanks for visiting AC Investor Blog.

AC

Labels: , , ,

Bookmark and Share

Wednesday, December 15, 2010 

Stocks to watch for the 16th of December

( click to enlarge )

I’m once again directing your attention to Eastman Kodak Company (NYSE:EK). I think this is a crucial time for the stock and my optimism remains at all time highs. Looking at the technical chart above, the stock has been uptrending quietly over the past four months and now the technicals are indicating the stock could begin an even juicier rally. The Stochastic Oscillator is moving higher and MACD is gaining momentum while RSI is at 64. Money Flow has been solid as investors have been accumulating and taking positions, which is another good signal. Moreover shares of Eastman Kodak are on top of 50 and 200 day moving average and has the chance to bring 50-day moving average above 200-day moving average to bring the stock back to bull market. Next major resistance level is $5.48. So, if you like upward continuation bounce plays, take a close look at EK. Technically speaking, I believe EK has a good setup and uptrend.

 ( click to enlarge )

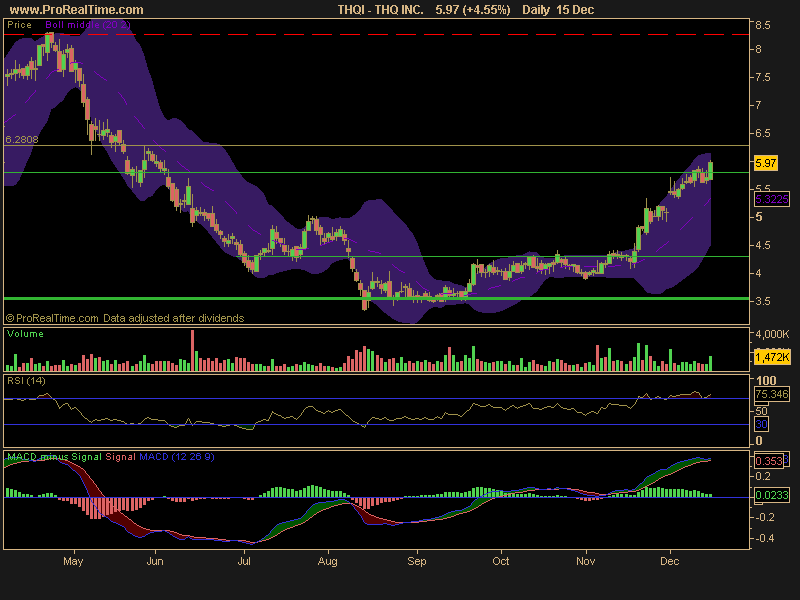
THQ Inc. (NASDAQ:THQI) - Today the stock broke an important resistance level and could go to $6.28 in short-term. Volume confirms. The technical chart shows very strong upward momentum as the stock is above the major moving averages with both 50-day and 200-day moving average. All indicators still point to a bull market.

 ( click to enlarge )

Allied Irish Banks, plc. (NYSE:AIB) is slowly recovering. The $1.46-$1.50 area is a critical resistance region that can determine overall bias for the stock in short-term. Keep an eye on these levels !
( click to enlarge )

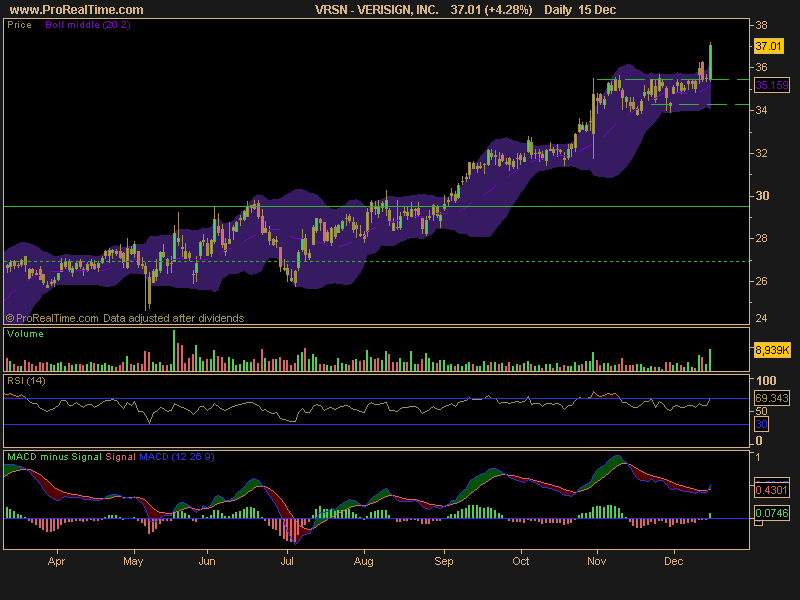
Shares of Verisign, Inc. (NASDAQ:VRSN) made a new 52 week high today closing at $37.01 on heavy volume. The stock hit a high of $37.18, which is now resistance for thursday’s continuation move. If the stock can break through resistance, we should see another strong upside move. VRSN will move very quickly, so watch the stock closely on Thursday.

Other stocks to watch : 

Unusual volume in today's trading session

AWYI - Ariel Way, Inc.
ZLUS - CoreStream Energy, Inc.
DYN - Dynegy Delaware Inc
TDCP - 3DIcon Corporation
GNTA - GENTA INC
BLOAQ - Blockbuster Inc
SCLL - Stem Cell Innovations, Inc.
NVS - NOVARTIS A G
HCP - HCP Inc
BGOI - BONANZA OIL & GAS
CYPB - Cypress Bioscience
PRPM - Propalms, Inc
FBC - FLAGSTAR BANCORP INC
MSLP - MUSCLE PHARM CORP
MNKD - MANNKIND CP
ACL - Alcon Inc
BLOBQ - Blockbuster B
STR - QUESTAR CORP
AMNZF - Golden Prospect PLC
SMEV - Simulated Environment Concepts Inc
MOTR - Motricity Inc
GAPTQ - GREAT ATLANTIC & PA
IVR - Invesco Mortgage Ca
JOE - ST JOE CORP
WEST - Akeena Solar Inc
JOYG - Joy Global Inc
KEM - Kemet Corp
SMCE - SMC Recordings Inc.
CBCGQ - The Colonial BancGroup, Inc.
BBX - BANKATLANTIC BANCOR
GTN - Gray Television Inc
UTRM - United Treatment Centers, Inc.
XING - Qiao Xing Uni Re
TVCE - TVC Telecom Inc.
PDPR - Marathon Group Corp
MESAQ - Mesa Air Group
ILVC - Intelligent Living Corp.
RNRG - REVONERGY INC
AKRX - Akorn, Inc.
UA - UNDER ARMOUR INC
RPC - AMDL Inc
AOTL - AeroTelesis Inc
CPRT - Copart, Inc.
ADXS - ADVAXIS INC
GNAU - General Automotive Co
UVFT - UV Flu Technologies
THLD - THRESHOLD PHARMACEUTICAL

The following list show stocks whose On Balance Volume has been increasing over the last 3 days

S - Sprint Corp FON Group
Q - QWEST COMM INTL INC
CMCSA - Comcast Corporation
ORCL - Oracle Corporation
AMGN - Amgen Inc.
VZ - Verizon Comm
BP - BP AMOCO ADS
EMC - EMC CORP
MRK - Merck & Co
HL - HECLA MINING CO
SD - Sandridge Energy Inc
ALU - ALCATEL
HD - HOME DEPOT INC
MDT - MEDTRONIC INC
CMCSK - Comcast Corporation
ITUB - Itau Unibnco Adr
HCP - HCP Inc
CVS - CVS Caremark Corp
TGB - Taseko Mines Ltd NPL
CVX - Chevron
NOVL - Novell, Inc.
NUE - NUCOR CORP
BAX - BAXTER INTERNATIONAL
TYC - TYCO INTL LTD
MNKD - MANNKIND CP
PEP - PEPSICO INC
VOD - Vodafone Gp Plc
WAG - WALGREEN CO
HON - HONEYWELL INTERNATIONAL
CAT - Caterpillar Inc
EXC - EXELON CORPORATION
SWC - Stillwater Mining Co
RIG - Transocean Ltd
WY - WEYERHAEUSER CO
DUK - DUKE ENERGY CORP
CTL - Centurylink Inc
ACN - Accenture Plc
FE - FIRSTENERGY CORP
STJ - ST JUDE MEDICAL INC
IR - INGERSOLL RAND CO
LYB - Lyondell Basell Ind
EGO - ELDORADO GOLD CP
EMR - EMERSON ELECTRIC CO
WU - Western Union
TTM - TATA MOTORS LTD ADS
TRV - The Travelers Co
CFN - Carefusion Cp
BBBY - Bed Bath & Beyond Inc.
AYE - ALLEGHENY ENERGY INC
K - KELLOGG CO
EXEL - Exelixis, Inc.
ITW - ILLINOIS TOOL WORKS
VMC - VULCAN MATERIALS CO
A - Agilent Technologies
UBS - UBS AG
CMS - C M S ENERGY CORP
GRS - GAMMON GOLD
CLF - Cliffs Natural Resources
IRM - IRON MOUNTAIN INC
PAYX - Paychex, Inc.
CA - CA Inc
NIHD - NII Holdings Inc
TEX - TEREX CORP
CNP - CenterPoint Energy Inc
VRX - Valeant Pharmaceutical
AMX - America Movil SA
WM - WASTE MANAGEMENT INC
SFI - ISTAR FINANCIAL INC 7
OXY - OCCIDENTAL PETROLEUM
ECL - ECOLAB INC
TXT - TEXTRON INC
AN - AUTONATION INC
ASBC - Associated Banc-Corp
AON - AON CORP
ARG - AIRGAS INC
LIFE - Invitrogen Corporation
TLM - TALISMAN ENERGY INC
XEL - XCEL ENERGY INC
GAME - SHANDA GAMES LTD
CMI - CUMMINS ENGINE CO INC
NKE - NIKE INC CL B
CHU - CHINA UNICOM LTD
LRCX - Lam Research Corporation
BUCY - Bucyrus Intl
KG - KING PHARMACEUTICAL
PBI - PITNEY BOWES INC
OI - OWENS ILLINOIS INC
STO - Statoil ASA
CE - CELANESE CORPORATION
WBD - WIMM BILL DANN FOODS
NTRS - Northern Trust Corp
CPN - Calpine Corp
GRMN - Garmin Ltd
AEE - AMEREN CORP
HBC - HSBC Holdings PLC
SYK - STRYKER CORP
PCG - P G & E CORP HLDG CO
CVD - COVANCE INC
ILMN - Illumina, Inc.

The following list show stocks whose On Balance Volume has been decreasing over the last 3 days

BBY - BEST BUY CO INC
CSCO - Cisco Systems, Inc.
F - FORD MOTOR COMPANY
LVS - LAS VEGAS SANDS CP
MGM - Mgm Resorts Int
UNG - United States Natural
MET - METLIFE INC
BRCD - Brocade Communications
XRX - XEROX CORP
MRVL - Marvell Technology
UAL - UAL CORP
ODP - OFFICE DEPOT INC
NG - NOVAGOLD RESOURCES INC
MPEL - Melco Crown Adr
MCD - MCDONALDS CORP
ONNN - ON Semiconductor Co.
SWY - SAFEWAY INC
TIE - TITANIUM METALS CORP
KEM - Kemet Corp
GMCR - Green Mountain Coffee
UPS - UPS
ARTG - Art Technology Group
AKAM - Akamai Technologies
UEC - Uranium Energy Corp
JCP - PENNEY J C CO INC
CNX - CONSOL Energy Inc
ADI - ANALOG DEVICES INC
SOL - Renesola Ltd
GMR - GENERAL MARITIME CORP
VSH - Vishay Intertechnology
LCI - LANNETT COMPANY
UNP - UNION PACIFIC CORP
PMCS - PMC - Sierra, Inc.
NYT - New York Times Co
TQNT - TriQuint Semiconductor
MF - MF Global Hld Ltd
SINA - sina.com
ETFC - E*Trade Financial Inc
CAKE - Cheesecake Factory
TGA - TransGlobe Energy Corp
ASML - ASM Lithography Holdings
ARMH - ARM Holdings, plc
DRI - DARDEN RESTAURANTS INC
WYNN - Wynn Resorts LTD
HMIN - Home Inns & Hotels
STR - QUESTAR CORP
YGE - Yingli Green Energy
TSLA - Tesla Motors Inc
RRC - Range Resources Corp
PX - PRAXAIR INC

Disclaimer : This is not an investment advisory, and should not be used to make investment decisions. Information in AC Investor Blog is often opinionated and should be considered for information purposes only. No stock exchange anywhere has approved or disapproved of the information contained herein. There is no express or implied solicitation to buy or sell securities. The charts provided here are not meant for investment purposes and only serve as technical examples. Don't consider buying or selling any stock without conducting your own due diligence.  

As always, good luck !

AC

Labels: , , ,

Bookmark and Share

Saturday, August 08, 2009 

Three stocks to keep watching - Ciena, Trinity Industries and Verisign

Chart courtesy of www.stockcharts.com ( click to enlarge )

CIEN continues to move higher and it still looks strong on its daily chart. I raised resistance to $11.78, which was Wednesday’s high. The stock is sitting right on its 13 day moving average at $11.33. The technicals, although basic, point to a move higher in the coming days. The MACD indicator is above its signal line and is indicating further strength. In addition, the RSI indicator is moving up above 50 and the +DI is greater than the -DI by a great margin, indicating a Bullish trend. CIEN can be a fast moving stock, so watch it closely on Monday.

Chart courtesy of www.stockcharts.com ( click to enlarge )

TRN showed strength on Friday, as the stock closed up $.94 on the day. This stock is setting up for a big upside move, and I'm going to be there when it happens. If TRN can break through $16.03, we should see volume buying in the stock. From the technical chart both MACD and KD are showing bullish sign as MACD is rising near 0 while KD is crossing up. Keep this one on your radar for Monday.

Chart courtesy of www.stockcharts.com ( click to enlarge )

VRSN traded lower on Friday, as the company released earnings after Thursday’s close. The stock traded heavy volume as it hit a low of $18.44 on the day. I will be watching VRSN on Monday, looking for a follow through move. If the sellers come back and take VRSN back through Friday’s low, we should see strong volume as the stock moves lower. Looking at the technical chart, the pullback below the short-term support level accompained by a bearish MACD crossover, suggests that the selling pressure dramaticaly increased and the stock might test $18 levels in the short term if it is able to sustain below $19.50.

Disclaimer : Trading stocks involves risk, this information should not be viewed as trading recommendations.The charts provided here are not meant for investment purposes and only serve as technical examples.

That's all Folks. Have a Great Weekend...
Cheers!

AC

Labels: , ,

Bookmark and Share

Saturday, May 23, 2009 

Stocks to watch next week - Verisign, Helmerich & Payne and Noble Corporation

Chart courtesy of www.stockcharts.com ( click to enlarge )

NE remains in a clear uptrend. The outlook is bullish and the stock could move to 33-34 levels in the near term. Fresh exposures may be considered on a close above 31.63. Stop-loss for existing holdings may be placed at 29.23. My model goes long targeting 35.08. CCI heading up towards 100 line on daily chart. As long as NE holds the lower channel trendline, the bulls are in firm control.

Chart courtesy of www.stockcharts.com ( click to enlarge )

HP is sitting near its 200 day moving average at $30.70. I consider it to be a good support because it served as an important resistance level twice in the past. However, I note that the daily momentum indicator is displaying bearish divergence, which portends weakening in the bullish momentum. Hold with a stop-loss at $29.64.

Chart courtesy of www.stockcharts.com ( click to enlarge )

This is a good looking chart. VRSN has been consolidating for the past two weeks after a nice channel breakout. It has been pulling back on decreasing volume and is starting to turn back up on the 20-day moving average. In addition, the technical daily chart shows this might be a good time to buy as the stock is trading above 50 day and 200 day moving average while MACD is above 0, indicating bull market. VRSN is now sitting near the previous breakout area which could provide a great support.

Disclaimer : Trading stocks involves risk, this information should not be viewed as trading recommendations.The charts provided here are not meant for investment purposes and only serve as technical examples.

That's all Folks. See you on Tuesday !!! Enjoy your weekend !!!

AC

Labels: , ,

Bookmark and Share

Wednesday, May 20, 2009 

Trade Ideas for Thursday - Symantec and Verisign

Chart courtesy of www.stockcharts.com ( click to enlarge )

VRSN - The stock didn’t made a significant moves on Wednesday. My model remains long, targeting 25.83. Immediate support is seen at 22.93. The technical chart is still showing buy signal with stock trading above 50 day moving averages with MACD on top of "0".

Chart courtesy of www.stockcharts.com ( click to enlarge )

SYMC - Today, the stock continued it’s bearish momentum. On the daily chart, we can see that the stock tested but failed to break its 200-day moving average at $15.66. Looks like more downside potential likely after the stock failed to move past this level on a closing basis. Immediate support is seen at 15 followed by 14.5. Initial resistance at 15.60.

Disclaimer : Trading stocks involves risk, this information should not be viewed as trading recommendations.The charts provided here are not meant for investment purposes and only serve as technical examples.

That's all Folks. See you tomorrow !!!

AC

Labels: ,

Bookmark and Share

Saturday, May 09, 2009 

Hot stocks to watch next week - Verisign and Yahoo

Chart courtesy of www.stockcharts.com ( click to enlarge )

Since the Nov ’08 low was reached, Yahoo has been trading within a 6-month uptrend channel. This week, the stock price finally crossed the 200 day moving average, indicating a buy. From a technical perspective, a buy is signalled when the stock’s closing price crosses above the moving average from below after a down-trend. As long as the stock price is above the MA the trend is defined as bullish. The technical side of the stock does look pretty good as indicators such as MACD, OBV and RSI all indicates continuous trend of strenght. Previous high last October is now the current resistance at 17.20.

Chart courtesy of www.stockcharts.com ( click to enlarge )

Verisign broke out of a bullish horizontal channel pattern Friday on a large increase in volume to 13.8m shares compared to its daily avg of less than 4m. Bullish channel breakout suggests more medium term upside. Although the MACD suggests that the medium term uptrend momentum is still intact which favors a stable and sustainable recovery, there could still be a near-term pullback as the RSI has reached the overbought region. As such, there could be a retest of the breakout area which would serve as confirmation. But for now, the stock looks like a nice potential play for an aggressive trader. After the recent positive break out above its 50-day MA and 200-day MA, the stock could see more upside potential in the weeks ahead. The next resistance line is at 25.83.

Disclaimer : Trading stocks involves risk, this information should not be viewed as trading recommendations.The charts provided here are not meant for investment purposes and only serve as technical examples.

That's all Folks. See you on Monday !!!

AC

Labels: ,

Bookmark and Share

Friday, September 26, 2008 

Stock Picks and Trade Ideas for Friday - VRSN, SBUX, BRCM

Chart courtesy of www.stockcharts.com ( click to enlarge )

BRCM - The immediate support zone for the stock lies at the $19. A close below this level would push the stock to lower levels of $18.72-18.55. However, the break of $20 would send BRCM on another corrective rally, but we remain bearish below $21 a break is needed to challenge last weeks highs at $22.46. I just want also to point out that the daily MACD is diverging positively suggesting a recover is just ahead, with a rally to about $20 as the first target.

Chart courtesy of www.stockcharts.com ( click to enlarge )

SBUX - Technically, there is no reason to take exposure in this stock as there is no evidence of the reversal of the ongoing downward move. For now, it would be better to stay away from this stock. The near-term outlook is bearish and the stock could drop to the $14.50-$14 range. Stop loss for long positions may be placed at $14.71. A close below $14.50 would impart weakness in the stock.

Chart courtesy of www.stockcharts.com ( click to enlarge )

VRSN made a strong upside reversal last week. The technical chart above suggests that stock might find now resistance at $27.58 ( 20 daily moving average ). Only a close above this level would suggest further upside. Remain invested with a stop loss at $24.99.

Disclaimer : Trading stocks involves risk, this information should not be viewed as trading recommendations.The charts provided here are not meant for investment purposes and only serve as technical examples.

That's All. See you tomorrow !!!

AC

Labels: , ,

Bookmark and Share

Monday, March 03, 2008 

Stocks to watch today - FSLR, RIMM, CNXT, SWC, VRSN, BAC , JPM

Chart courtesy of stockcharts

JPM - The stock broke support at $42 on Friday and broke below its 50 and 200 day moving averages over this month. In addition other technical indicators such as MACD and KD also show weak signal as MACD is below 0 and K line is dropping below D line. The JPM is looking ready to test its lows again in the next weeks.

Chart courtesy of stockcharts

BAC - Sideway channel broken. Trouble ahead. I don't think it will go up much. The question now is how deep will be the correction.

Chart courtesy of stockcharts

VRSN has been shifting from a down trend to a slight uptrend. On friday stock closed below its 20 and 50-day moving averages, so from a technical perspective a run to $34 ( bottom of the channel ) is very likely. MACD and KD also show weak signal as MACD near 0 and K line is dropping below D line.

Chart courtesy of stockcharts

SWC - Stillwater Mining broke out to all time highs. This is a hot buy from a technical perspective, however and at this point the stock is too extended for additional positions. Right now it is way too risky for a long position.

Chart courtesy of stockcharts

CNXT - Not a pretty picture. Descending triangle broken to the downside.

Chart courtesy of stockcharts

RIMM - I consider RIMM has broken out of the downtrend. Currently building base for the next up move. If it is able to break $112.26, first target $122.

Chart courtesy of stockcharts

FSLR - Long term uptrend. Still under correction. Possible support at $200.

Disclaimer : Trading stocks involves risk, this information should not be viewed as trading recommendations.The charts provided here are not meant for investment purposes and only serve as technical examples.

That's All. Have a great weekend !!!

AC

Labels: , , , , , ,

Bookmark and Share

Monday, September 24, 2007 

VRSN- Ready to move, EMC - Breakout

Chart courtesy of stockcharts

Looking at the technical chart, stock show a continuation of the uptrend formed in August. The technical chart is still showing buy signal with stock trading above 50 day and 200 day moving averages, and with MACD on top of 0 and K line on top of D line. The momentum in the last two months has been great on Verisign, stock came from $28 to above 34$ and now maybe ready to move up again, with a possible break of the ascending traingle. So, keep an eye on VRSN for a possible breakout over $34.

Chart courtesy of stockcharts

Shares of EMC were up today more than 7% to $20.51 after it was upgraded to "outperform" by Bear Stearns and to "buy" by Citigroup due to the performance of virtualization subsidiary VMware. Stock has broken out a tight consolidation area today and made a new 52 week high during regular session, stock opened ways for new highs.

Disclaimer : Trading stocks involves risk, this information should not be viewed as trading recommendations.The charts provided here are not meant for investment purposes and only serve as technical example.

That's All. Have a great evening !!!

AC

Labels: ,

Bookmark and Share

Saturday, July 14, 2007 

Top picks for next week - First Solar, LPHI, IBM, RIMM, AAPL ,VRSN

Chart courtesy of stockcharts

FSLR " First Solar " has printed an impressive impulse to the upside in the last weeks. In the intermediate and long term we should see higher prices, I suppose based on the chart above. In the short term, after the big gap ( on Monday ) and the continuation of the run, prices have initiated a consolidation phase in this week. Difficult to anticipate when and if a new up leg will begin. For a possible scenario to the downside, the first supports are between 110$ and 105$, but there is a possible for prices explode again to the upside, investors confident are extremelly high in this stock, so pay attention for these two possible scenarios under the table.

Chart courtesy of stockcharts

VeriSign shares " VRSN " have been in focus on Friday after Jefferies and Co. raised his rating to "Buy" from "Hold" on stock and their price target from $27 to $39. As seen by the chart, VeriSign broke out today a tremendous resistance at 33$, so now pullbacks in the stock should be valued as buying opportunities. Technically speaking based on above chart stock is trading in an extreme Overbought conditions and today movement may predict some profit taking soon. From a technical perspective stock is trading in a Bull Market with s 50 dma on top of 200 day moving average and going up. No resistance above and support is now at 33$ previous resistance area.

Chart courtesy of stockcharts

AAPL Blow up again !!! Looking at the chart above stock broke out 134$ mark, reaching during today session a new historic level of close at 137.73$. Stock is again in a breakout mode. Let's see if stock will sustain tomorrow this movement next week. Keep AAPL in your watchlist.

Chart courtesy of stockcharts

RIMM has closed at 227.52$ above the previous top of 215.47$ printed on 12 July. Stock broke out to new highs confirmed by the volume above average. The daily chart of Research in Motion suggests a strong confidence in stock, a clear uptrend momentum. Keep an eye on RIMM next week, it's in an extremelly Bullish mode.

Chart courtesy of stockcharts

LPHI- It seems the stock can breakout the 40$ previous top. Indicators are printing good signs in the chart, such as MACD.

Chart courtesy of stockcharts

IBM may be ready to breakout !!
Looking at the chart above stock has had a nice run over the past two months and may be ready now for a possible breakout over 109.66$. I'll be Bullish in this stock if breakout this area.

Disclaimer : Trading stocks involves risk, this information should not be viewed as trading recommendations.The charts provided here are not meant for investment purposes and only serve as technical examples.

That's all. Enjoy your weekend !!!

AC

Labels: , , , , ,

Bookmark and Share
Contact

About Me

    Photobucket
  • I'm a 48 year old Independent Trader using proprietary technical analysis with more than 20 years experience of investing in the US stock markets. I started this blog in 2006 simply as a way to share my thoughts about capital, risk management, and trading. My blog contains only my personal opinion and is provided for informational purposes only.

  • Benzinga.com supporter

    Benzinga.com supporter


    FREE NEWSLETTER

      Enter your email address:

      Delivered by FeedBurner

      Subscribe my feed :

    Support AC

    • Support AC Investor Blog, Donate with PayPal

    Advertising

      Interested in advertising on AC Investor Blog ? Click Here

    TRANSLATOR

    Site Information

    Stock Market Blogroll

    Friends BLOGROLL

    ARCHIVES

Powered by Blogger
and Blogger Templates


Add to Google