Chart courtesy of
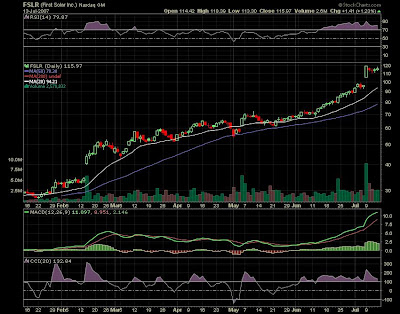
stockchartsFSLR " First Solar " has printed an impressive impulse to the upside in the last weeks. In the intermediate and long term we should see higher prices, I suppose based on the chart above. In the short term, after the big gap ( on Monday ) and the continuation of the run, prices have initiated a consolidation phase in this week. Difficult to anticipate when and if a new up leg will begin. For a possible scenario to the downside, the first supports are between 110$ and 105$, but there is a possible for prices explode again to the upside, investors confident are extremelly high in this stock, so pay attention for these two possible scenarios under the table.

Chart courtesy of
stockchartsVeriSign shares " VRSN " have been in focus on Friday after Jefferies and Co. raised his rating to "Buy" from "Hold" on stock and their price target from $27 to $39. As seen by the chart, VeriSign broke out today a tremendous resistance at 33$, so now pullbacks in the stock should be valued as buying opportunities. Technically speaking based on above chart stock is trading in an extreme Overbought conditions and today movement may predict some profit taking soon. From a technical perspective stock is trading in a Bull Market with s 50 dma on top of 200 day moving average and going up. No resistance above and support is now at 33$ previous resistance area.

Chart courtesy of
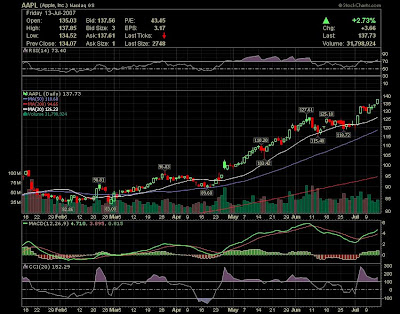
stockchartsAAPL Blow up again !!! Looking at the chart above stock broke out 134$ mark, reaching during today session a new historic level of close at 137.73$. Stock is again in a breakout mode. Let's see if stock will sustain tomorrow this movement next week. Keep AAPL in your watchlist.
RIMM has closed at 227.52$ above the previous top of 215.47$ printed on 12 July. Stock broke out to new highs confirmed by the volume above average. The daily chart of Research in Motion suggests a strong confidence in stock, a clear uptrend momentum. Keep an eye on RIMM next week, it's in an extremelly Bullish mode.

Chart courtesy of
stockchartsLPHI- It seems the stock can breakout the 40$ previous top. Indicators are printing good signs in the chart, such as MACD.
IBM may be ready to breakout !!
Looking at the chart above stock has had a nice run over the past two months and may be ready now for a possible breakout over 109.66$. I'll be Bullish in this stock if breakout this area.
Disclaimer : Trading stocks involves risk, this information should not be viewed as trading recommendations.The charts provided here are not meant for investment purposes and only serve as technical examples.That's all. Enjoy your weekend !!!
AC
Labels: AAPL, FSLR, IBM, LPHI, RIMM, VRSN
 Chart courtesy of stockcharts
 Chart courtesy of stockcharts
 Chart courtesy of stockcharts
 Chart courtesy of stockcharts


