-Financial Tools Futures Market--TRADE IDEAS-- OPTION ALERTS -BENZINGA PRO-

Sunday, December 11, 2022 

Swing Trade Ideas for the coming week

Apologies for the lack of blog updates in the past couple of weeks. I will try to be more consistent in posting but make no promises. Managing family time on weekends with markets, it's not easy.

( click to enlarge )

I still own some bitcoins. The chart pattern is compressed and Bitcoin is coiling up for a larger move. Breakout watch over 17400

( click to enlarge )

In the short-term, Bank of America Corp (NYSE:BAC) is extremely oversold and sentiment is negative. It can be very hazardous to sell into this condition. The stock opened Friday`s session at $32.11 and intra-day was ranging at 32.60-32.08 ending the session with a small loss of 0.18%. I think the stock looks ripe for a rally from extremely oversold conditions.

( click to enlarge )

PayPal (NASDAQ:PYPL) is this a bullish flag 4 hour chart? Some positive divergences in the chart showing up. Only a close above the 75 level would confirm this view. The underlying primary trend remains down. I like Paypal at current levels (we are at 2018 levels).

( click to enlarge )

Chemomab Therapeutics Ltd (NASDAQ:CMMB) witnessed a follow-up buying with a surge in volume like in late May/early June. This could be the start of a nice rebound! With small cap stocks history tends to repeat itself. If you follow the market long enough and study the small cap stocks closely you can find many consistencies, the trends, and other helpful signs that can help you turn a profit. Watch the break of 2.50 next week for a potential new explosive move to the upside.

( click to enlarge )

SINTX Technologies Inc (NASDAQ:SINT) Over the past 4 weeks we've rallied up to 0.145 and now back down to 10c forming the right shoulder of the Inverted Head and Shoulders pattern. It has the potential to break out, as this is one of the most reliable trend reversal patterns. The stock price declined by approximately 80% over the last 3 months. Despite the significant losses, the stock seems to be developing a reversal pattern that could see its price improve. A decisive close above the $0.14 resistance level could push this penny towards 35c. When it comes to penny stocks, nothing is impossible, look what happened with AMAM on Friday with a 1000% gain.

( click to enlarge )

Digital Brands Group Inc (NASDAQ:DBGI) closed back above the downtrend line from mid-Nov highs on the hourly chart to confirm the bullish momentum divergence. The stock needs to break Friday's high of $4.4 to expect a strong rally at this point. Low float former runner.

( click to enlarge )

Mullen Automotive Inc (NASDAQ:MULN) is still in bottoming mode it looks like. The daily technical indicators are looking better now for the stock. A reversal may be on the way. Only a close below 18c will invalidate the current potential bottom scenario.

( click to enlarge )

Treasure Global Inc (NASDAQ:TGL) Basing. Breakout watch over 2.21

( click to enlarge )

I like Lucid Motors (NASDAQ:LCID) for a bounce play over 8.84 if the market gets a relief bounce.

( click to enlarge )

Smartsheet Inc (NYSE:SMAR) flagging. Breakout watch over 38.51
( click to enlarge )

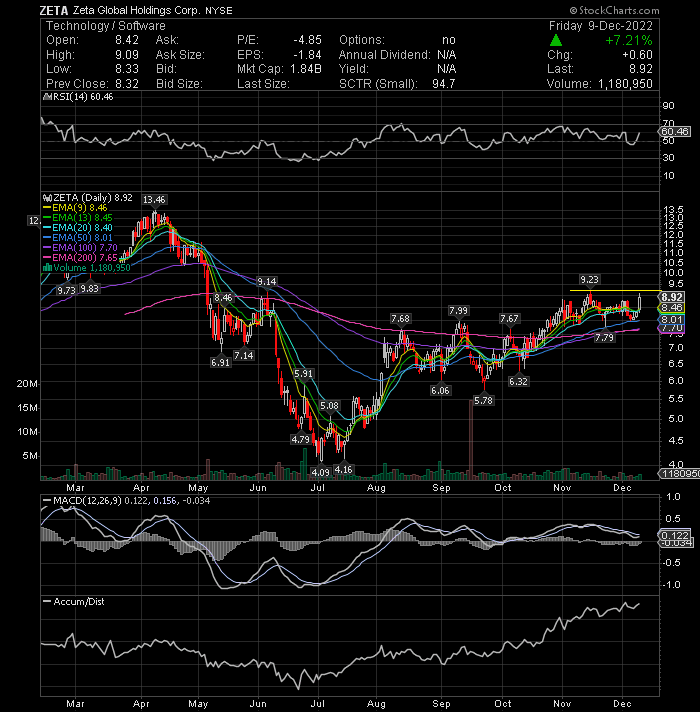
Zeta Global Holdings Corp (NYSE:ZETA) is setting up to break out and has one more level to go, which is $9.23

Disclaimer : This is not an investment advisory, and should not be used to make investment decisions. Information in AC Investor Blog is often opinionated and should be considered for information purposes only. No stock exchange anywhere has approved or disapproved of the information contained herein. There is no express or implied solicitation to buy or sell securities. The charts provided here are not meant for investment purposes and only serve as technical examples. Don't consider buying or selling any stock without conducting your own due diligence.

Thanks for visiting AC Investor Blog.

AC

Labels: , , , , , , , , , ,

Bookmark and Share

Saturday, January 12, 2019 

Here are a few setups for next week !! Good luck to all

( click to enlarge )

Netflix, Inc. (NASDAQ: NFLX) surged 3.98%, yesterday on higher-than-average volume and finished at its highest close in more than 3 months. It closed at 337.59, substantially above key resistance at 332.05, confirming the breakout. Friday's close was also near the high of the day, another good sign and indication of possible continuation of current momentum. On watch.

( click to enlarge )

Finisar Corporation (NASDAQ: FNSR) over the last three weeks has formed an ascending triangle pattern with a double-top in the 21.9 area, which now represents a key resistance area which could be broken in the next few days. If a breakout next week occurs, we could see a move toward the 23 level.

( click to enlarge )

BlackBerry Ltd (NYSE: BB) Price appears to be forming a descending channel on its daily time and is on its way to test the resistance at 7.70. If this breakout occurs we could see Blackberry in the 8-8.20 area in the next couple of trading days.

( click to enlarge )

Inseego Corp (NASDAQ: INSG) broke the bullish flag pattern and formed a new high. Any pullback could be bought by dip buyers.

( click to enlarge )

This stock has a very interesting technical daily chart and the flu season is in full swing. Any stock that has the slightest bit to do with the flu could see a nice rally this month. The MACD line is starting to curl upward, which should eventually lead to price increases. If this happens here we could see VXRT rally to almost $3.4

( click to enlarge )

New Age Beverages Corp (NASDAQ: NBEV) is consolidating in a possible large "symmetrical triangle" pattern with short-term bullish tendency, pointing to an impending technical breakout soon. The daily MACD indicator on its daily time frame is also suggesting that upside pressure is starting to resume. The breaking of Friday’s highs would be a buy signal.

( click to enlarge )

SAExploration Holdings Inc (NASDAQ: SAEX) A nice recovery for this spec play from $2 to $6 last week. The stock remains overbought, however it has some serious momentum on its side. Trading these type of stocks that have large moves to the downside can make for great trades, when they finally rally, as SAEX has done last week. CEI and PED are others that might attract some auxiliary attention next week. Here is the technical daily chart for u guys, I dont own any position on SAEX (unfortutanely) just watching.

( click to enlarge )

Camber Energy Inc (NYSEAMERICAN: CEI) is a spec play worthy of some attention as well. With some buying volume this stock could soar just like SAEX. As I mentioned in my trading rules article in October, these kind of stocks, are the ones to trade not to invest. In this particular case, i see here an opportunity based on the daily chart for a nice swing trade, which was one of main reasons that made me buying it again at 1.08. Plus, the massive rally on its sympathy play SAEX. Looking at the daily chart, it seems to be forming a potential double bottom and some key indicators are displaying that potential scenario. That said, my strategy is simple. Stop loss at 90c and short-term target 1.43 in case of normal daily average volume. Over 10M shares, my target would be +$2.4 keep it simple. Small cap companies can be a good opportunity because of the cheap share price, but we need to have rules to trade them.

( click to enlarge )

Bank of America Corp (NYSE: BAC) worth keeping an eye on, may need to build some energy. However, if we reclaim the EMA50 and hold, i expect a rapid move toward $28 area.

( click to enlarge )

General Electric Company (NYSE: GE) is really starting to get going. I like the way its been trading lately and I think it could hit $10 in the coming weeks, but before that, the stock needs to break this small consolidation area to expect another move to the upside. Long setup on watch.

( click to enlarge )

Rewalk Robotics Ltd (NASDAQ: RWLK) Nice candle Friday on above average volume. It has a nice gap over 26c. Still on top of my small caps watchlist (added last month around 18c).

( click to enlarge )

AK Steel Holding Corporation (NYSE: AKS) again closed above its 20-day EMA. This stock ,in my view, looks to be in the early stages of another rally that will bring the stock to over $3 a share.

Note: Small-capitalization stocks are on fire again, so i will be here as long as the momentum is in our favor (keep in my i dont trade OTC stocks). Small-cap stocks generally provide the best returns for day traders, but we need to be aware of the risks. There could be liquidity problems if someone is trying to take a big position in a small stock, so if your account is small, please diversify in order to avoid been stuck in just one stock and use tight stops.

During the day I tweet many times to my readers. I encourage everybody to subscribe AC Investor Blog twitter and newsletter, so you can receive my trade ideas and stock news in real time.

Disclaimer : This is not an investment advisory, and should not be used to make investment decisions. Information in AC Investor Blog is often opinionated and should be considered for information purposes only. No stock exchange anywhere has approved or disapproved of the information contained herein. There is no express or implied solicitation to buy or sell securities. The charts provided here are not meant for investment purposes and only serve as technical examples. Don't consider buying or selling any stock without conducting your own due diligence.

Thanks for visiting AC Investor Blog.

AC

Labels: , , , , , , , , , , ,

Bookmark and Share

Monday, July 18, 2016 

Stocks to Watch for July 19, 2016

( click to enlarge )

Advanced Micro Devices, Inc. (NASDAQ:AMD) has been in an orderly bullish up-channel since mid-April and today, it made a new 52-week high at $5.57. Look for follow-through on Tuesday with increasing volume to confirm today's move.

( click to enlarge )

GameStop Corp. (NYSE:GME) broke out above its key resistance level today and surged considerably higher amidst impressive buying pressure after CEO Paul Raines told CNBC that sales were up 100% in 462 stores that are gyms in the Pokemon Go app. I expect GME to continue to gain investor interest going forward. Keep it on your watch list tomorrow.

( click to enlarge )

Bank of America Corp (NYSE:BAC) Nice breakout of resistance on good earnings and volume confirmation. Could be a good buy on a dip near $13.75 if given the chance.

( click to enlarge )

Abercrombie & Fitch Co. (NYSE:ANF) broke out of a bullish flag/consolidation it has been in for the past week. Go long on the break of Monday’s high at 20.17.

( click to enlarge )

Glu Mobile Inc. (NASDAQ:GLUU) had a very good rally accompanied with large volume today. GLUU is one stock that seems to be turning around again and some technical indicators are confirming the recent positive movement. Buyable on a pullback to the pivot.

( click to enlarge )

Zynga Inc (NASDAQ:ZNGA) has consolidated sideways for the past several sessions under resistance near $2.90. If the stock clears resistance the move may be powerful.

If you want to contact me for advertising opportunities on blog or twitter, then get in touch via email

Disclaimer : This is not an investment advisory, and should not be used to make investment decisions. Information in AC Investor Blog is often opinionated and should be considered for information purposes only. No stock exchange anywhere has approved or disapproved of the information contained herein. There is no express or implied solicitation to buy or sell securities. The charts provided here are not meant for investment purposes and only serve as technical examples. Don't consider buying or selling any stock without conducting your own due diligence.

Thanks for visiting AC Investor Blog.

AC

Labels: , , , , ,

Bookmark and Share

Thursday, March 31, 2016 

Stocks to Watch for April 01, 2016

( click to enlarge )

Medivation Inc (NASDAQ:MDVN) looks strong enough to move forward. The stock broke up through the resistance at $42.75 (Declining 200EMA) on huge volume of over 16 Million shares. At this stage, further rally is still possible in next several days. The breakout signals a continuation of the prior advance. Bulls have the near-term technical advantage and gained fresh upside momentum today. Next resistance levels to watch are $48.8 and $52. The stock has the potential for a strong follow through, so watch it closely on Friday.

( click to enlarge )

Bank of America Corp (NYSE:BAC) had a bit of indecision on today's trading session and may be moving lower tomorrow. It's too early to say but the daily technical chart is displaying some bearish divergences on both the MACD and Slow Sto indicating that this stock could reverse course. The short-term uptrend line should be used as stop-loss.

( click to enlarge )

I'm still watching shares of PTC Therapeutics, Inc. (NASDAQ:PTCT) due to the recent price action, volume, and momentum. Despite the general market's weakness, the stock made an impressive turnaround and rallied almost 6% to close the day at $6.44. If the stock closes above $6.70, you could see a big turnaround in this stock.

( click to enlarge )

Infoblox Inc (NYSE:BLOX) remains high on my radar due to the recent run up on volume. The technical chart is still showing buy signal with stock trading above 20,50,100-day exp moving averages and MACD on top of 0. Keep an eye for a possible breakout over $17.30.

( click to enlarge )

Commscope Holding Company Inc (NASDAQ:COMM) The daily technical indicators are displaying good signs. Watching for a breakout soon.

If you want to contact me for advertising opportunities on blog or twitter, then get in touch via email

Disclaimer : This is not an investment advisory, and should not be used to make investment decisions. Information in AC Investor Blog is often opinionated and should be considered for information purposes only. No stock exchange anywhere has approved or disapproved of the information contained herein. There is no express or implied solicitation to buy or sell securities. The charts provided here are not meant for investment purposes and only serve as technical examples. Don't consider buying or selling any stock without conducting your own due diligence.

Thanks for visiting AC Investor Blog.

AC

Labels: , , , ,

Bookmark and Share

Friday, January 29, 2016 

Stocks to Watch for January 29, 2016

( click to enlarge )

Facebook Inc (NASDAQ:FB) Looks ready to break out into new high territory. The daily technical chart above shows the stock is on a bull market as it is trading above both EMA50 and EMA200 and the EMA50 is on top of EMA200 heading upwards. The MACD just crossed above signal and the RSI chart is showing some strength in this movement. Watching 110.65 area for a squeeze.

( click to enlarge )

Intrexon Corp (NYSE:XON) had a strong upward jump yesterday on strong volume which broke over the expected resistance of 27.5 to 28 zone. Watch for a follow through day and consider a stop loss just below the most recent bottoming level around $25. Momentum is picking up with MACD climbing and MFI continues to trend higher. Long setup.

( click to enlarge )

Under Armour Inc (NYSE:UA) needs to take out the $85 resistance area in order to convince bullish buyers at these levels. The near-term outlook is bullish. I like the stock as a buy on any dip.


( click to enlarge )

Goldman Sachs Group Inc (NYSE:GS) is displaying a screaming buy divergence on the upside. A close above 158.24 will impart bullishness and will help the stock move to the $162 area. The stock price has been floating around this range (151.5/158) for several trading sessions in a row and I think we could see a sharp move higher from here. All major indicators are in favor of an upward price movement. Long set-up on watch.

( click to enlarge )

Kinder Morgan Inc (NYSE:KMI) has been slowly gaining traction amid strong buying pressure the last few days. A break through this 15.7 area could accelerate the stock higher.

( click to enlarge )

Bank of America Corp (NYSE:BAC) is in the process of bottoming and I expect a pop above $13.73 at some point in the coming days. Keep it on watch. Stop 12.92

If you want to contact me for advertising opportunities on blog or twitter, then get in touch via email

Disclaimer : This is not an investment advisory, and should not be used to make investment decisions. Information in AC Investor Blog is often opinionated and should be considered for information purposes only. No stock exchange anywhere has approved or disapproved of the information contained herein. There is no express or implied solicitation to buy or sell securities. The charts provided here are not meant for investment purposes and only serve as technical examples. Don't consider buying or selling any stock without conducting your own due diligence.

Thanks for visiting AC Investor Blog.

AC

Labels: , , , , ,

Bookmark and Share

Saturday, June 06, 2015 

Stocks to keep an eye on June 08, 2015

( click to enlarge )

Bank of America Corp (NYSE:BAC) Last week, the stock broke past a four-month resistance area with force. High volume accompanied the breakout. The upside target of this breakout is $18 but long term investors should expect a much higher return. The 9/20 day EMAs have acted as good support at least up until now. So, as long as support holds, the stock should continue to rally.

( click to enlarge )

Voxeljet AG (NYSE:VJET) has broken the upper line of a falling wedge, which was drawn during the last two months. Plus, the stock's MACD has also crossed above the signal line, which further confirms that the trend has switched from negative to positive which indicates that a rally is in progress and we should expect a move higher towards $8.72 where the 100-day EMA (pink line) is found. Note: Anthony Gerstein, Director of Investor Relations and Business Development will present at Stephens Spring Investment Conference in New York, NY on Wednesday, June 3rd, 2015, another catalyst for stock next week.

( click to enlarge )

Voltari Corp (NASDAQ:VLTC) experienced wild swings on Friday. At one point the stock was very over sold at 7.45 and then bounced all the way back to 8.36. I think this was a very important day, as the stock might be indicating the market capitulated at the lows. If Friday’s support holds next week, it could be a turning point for the stock. On the Hourly chart, it was important to see that the stock closed the week above all EMAs. The strong accumulation over the past days has shown funds moving into the company again and moved share prices upward. I'm currently accumulating this stock.

( click to enlarge )

ExOne Co (NASDAQ:XONE) is approaching a breakout point at the 13.50 level where it closed on Friday. A break above the 50-day EMA would lead to next targets in the 14.9 and then 16 area. The daily technical indicators are showing positive divergences. The MACD has moved above its signal line and the RSI is rising above the 50% level. Plus, the merged 13-day and 20-day EMAs are beginning to show an upward bias. I Really like the look of this daily technical chart...note earnings Jun 11 AMC.


( click to enlarge )

Gevo, Inc. (NASDAQ:GEVO) seems to be forming a Cup and Handle pattern as per the daily chart. Technically speaking, this is a bullish pattern but confirmation will come only after a break above the handle of the cup chart pattern. A daily close above $4.16 will be very bullish and the price target for this Cup & Handle break out could be around $5.25. In addition, the daily indicators are beginning to turn bullish again. The MACD has just crossed above its signal line and the RSI is back above 50 and pointing higher. Given the potential rosy outlook for biofuels, I am not surprised to see the company pursuing such an aggressive expansion strategy. That's my own opinion. I'm long.

( click to enlarge )

XOMA Corp (NASDAQ:XOMA) also looks great. $3.67 is an important resistance that once broken will set off a huge run up in price, the 1st target would be $3.97 which is the high of April. Key technical indicators are implying that investors have become more bullish since early May. The setup looks good for an upside breakout. On watch.

( click to enlarge )

The strong move in Kite Pharma Inc (NASDAQ:KITE) shares was something that I tweeted on Friday's morning b4 the move (Here is the tweet). The stock price broke out of a Bullish flag chart pattern accompanied by strong volume. I think we will see a nice follow through next week. This momentum could push this stock much higher from here. Next resistance is now seen at $66.40.

( click to enlarge )

On watchlist no trigger yet. TASER International, Inc. (NASDAQ:TASR) continues to consolidate in a very tight range. Long above $33. The stock has been in a nice uptrend for the last three monts and it looks very strong with the Key EMAs going up. There is plenty of accumulation on daily chart. Use the 50-day EMA as your stop-loss.


( click to enlarge )

Rambus Inc. (NASDAQ:RMBS) The stock is forming another bullish flag on the daily technical chart, which is usually the most bullish of consolidation patterns. Perhaps this is merely a pause in a strong uptrend. Watch for a break of 15.48 to continue the uptrend. Accumulation/distribution chart still looking good.

Recommending some great stuff to check out this weekend:

Benzinga Professional is my streaming platform. It is still available for you with a symbolic cost of just $ 1 for the first month. This is one of the best programs to use on a daily basis and that easily pays for itself. Check this OUT !!

Here is a great product that i recommend everybody to take a look: Vader Trades. They use a top down strategy to trade futures, options, and stocks. Methodology is based on divergences, profiles, sentiment, and short term fundamental/event driven opportunities. I definitely recommend everybody to check it out.

Have a fantastic weekend.

Disclaimer : This is not an investment advisory, and should not be used to make investment decisions. Information in AC Investor Blog is often opinionated and should be considered for information purposes only. No stock exchange anywhere has approved or disapproved of the information contained herein. There is no express or implied solicitation to buy or sell securities. The charts provided here are not meant for investment purposes and only serve as technical examples. Don't consider buying or selling any stock without conducting your own due diligence.

Thanks for visiting AC Investor Blog.

AC

Labels: , , , , , , ,

Bookmark and Share

Thursday, November 06, 2014 

Stocks to Watch for November 7, 2014

( click to enlarge )

El Paso Pipeline Partners, L.P. (NYSE:EPB) is setting up nicely to break out. Buy point would be on the day it blows through $41 on heavy volume. The Technical indicators are looking Bullish. The MACD is above signal line and above 0 line, which is a bullish indicator. Additionally to that, we also have the stock price currently above all EMAs.

( click to enlarge )

Chinanet Online Holdings Inc (NASDAQ:CNET) has been in a narrowing symmetrical triangle formation going back 3 weeks and its close today at 2.10 puts it near the descending trendline. A move above 2.18 would confirm the breakout of the pattern with a target of 2.50 and then 3.25. Initial stop loss is 1.88. In addition, the MACD is flashing a buy signal and the RSI is above 50. Technically, the stock can see a strong move above 2.20 levels.

( click to enlarge )

Sino-Global Shipping America, Ltd. (NASDAQ:SINO) spiked 24 cents, or 12%, today to 2.14 and appears poised to break through this bullish consolidation in a big way. A break of 2.25 would continue the momentum of its uptrend, with a short-term target at 2.72. The technical daily chart looks really bullish as the stock is trading above all major EMAs. In addition both RSI and MACD show bullish signal as MACD is above 0 and RSI is going up.

( click to enlarge )

DSW Inc. (NYSE:DSW) is close to a break out. The stock price action has remained under its daily 200-day exp moving average for some time. A break above the 31.55 level would be bullish.

( click to enlarge )

VirnetX Holding Corporation (NYSEMKT:VHC) Coiling up here. 6.12 area for movement. Keep on watch for the break on volume and go long.

( click to enlarge )

Bank of America Corp (NYSE:BAC) looks ready to make new highs. 17.41 breakout watch. The technical daily chart shows positive sign as both 50-day and 200-day exp moving average are both rising with MACD above 0 and RSI rising.

During the day I tweet many times to my readers. I encourage everybody to subscribe AC Investor Blog twitter and newsletter, so you can receive my trade ideas and stock news in real time.

Disclaimer : This is not an investment advisory, and should not be used to make investment decisions. Information in AC Investor Blog is often opinionated and should be considered for information purposes only. No stock exchange anywhere has approved or disapproved of the information contained herein. There is no express or implied solicitation to buy or sell securities. The charts provided here are not meant for investment purposes and only serve as technical examples. Don't consider buying or selling any stock without conducting your own due diligence.

Thanks for visiting AC Investor Blog.

AC

Labels: , , , , ,

Bookmark and Share
Contact

About Me

    Photobucket
  • I'm a 48 year old Independent Trader using proprietary technical analysis with more than 20 years experience of investing in the US stock markets. I started this blog in 2006 simply as a way to share my thoughts about capital, risk management, and trading. My blog contains only my personal opinion and is provided for informational purposes only.

  • Benzinga.com supporter

    Benzinga.com supporter


    FREE NEWSLETTER

      Enter your email address:

      Delivered by FeedBurner

      Subscribe my feed :

    Support AC

    • Support AC Investor Blog, Donate with PayPal

    Advertising

      Interested in advertising on AC Investor Blog ? Click Here

    TRANSLATOR

    Site Information

    Stock Market Blogroll

    Friends BLOGROLL

    ARCHIVES

Powered by Blogger
and Blogger Templates


Add to Google


