-Financial Tools Futures Market--TRADE IDEAS-- OPTION ALERTS -BENZINGA PRO-

Friday, April 02, 2021 

Stock market swing trade ideas for the week ahead


( click to enlarge )

Pyxis Tankers Inc (NASDAQ:PXS) has witnessed an excellent uptick overall during the past few sessions and it has been correlated with increasing volume. The stock closed 8.74% higher to 1.12 on Thursday after consolidating over 1 week within a narrow range. Considering the recent increase in volume, accumulation and money flow, I believe PXS could make a solid move higher given both its fundamental and technical factors. Momentum picking up with MACD climbing and RSI rising. In the past, PXS has experienced surges in valuation of over 50% in just days. MACD History on the chart above repeats for itself. Keep a close eye on PXS next week because it could be a strong play.

( click to enlarge )

Houston American Energy Corporation (NYSEAMERICAN:HUSA) shares decreased nearly 50% from a couple weeks ago after making a big uptick. Now share prices are ready to make a solid move, since it has started recovering from its rising EMA200 support zone. Additionally, its accumulation remains very high during the consolidation phase which is a very positive sign. So don't ignore it, consider taking advantage of the situation before the crowd. The daily MACD histogram has started to diverge positively and RSI is turning up. HUSA is another small Oil play that needs to be at the top of your watchlist next week.

( click to enlarge )

 CASI Pharmaceuticals Inc (NASDAQ:CASI) moved up about 9.22% on strong volume last week and it looks like a lot of traders booked gains from the upwards run, but I did exactly the opposite. With the resistance level already identified on the charts and with the huge insider activity revealed, I used the pullback to take a big long position. Usually when insiders buy shares, especially in large amounts it is a sign that positive things are coming. If CASI can keep going up and break the resistance at 2.50 this could further confirm the uptrend and would give a measured move target of nearly 3.25

( click to enlarge )

WISeKey International Holdings ADR (NASDAQ:WKEY) This NFT play is worth watching here.There is a positive MACD divergence on the hourly chart and this usually means that an upward movement is coming. On watch.

( click to enlarge )

Greenpro Capital Corp (NASDAQ:GRNQ) Some serious upside volume coming into this stock over the last few days. Correction is very flat and is showing me that the buying pressure remains strong. Look at the big volume bars. That is serious accumulation. Bullish continuation is very probable IMHO if it breaks 3.30 next week, the move could be explosive.

( click to enlarge )

Qualcomm (NASDAQ:QCOM) price broke out of a bottom pattern. Long entry triggered first target 142.85 From a technical standpoint, the stock has an up trending MACD, indicating potential accumulation and an up-trending RSI at 55 indicating room for potential further gains.

( click to enlarge )

The technical chart of Thomson Reuters Corp (NYSE:TRI) looks fairly appealing for a possible short term trade. The stock price is forming an ascending triangle pattern on a daily. If price breaks out above 89.69 then we should probably see a significant move to the upside next week.

( click to enlarge )

Hartford Financial Services Group Inc (NYSE:HIG) in another box (flagging), wait for the break.

( click to enlarge )

Camber Energy Inc (NYSEAMERICAN:CEI) Price should become explosive if this chart pattern is broken to the upside with volume. I want to go long this stock on a move above $1.14 for a day trade.

( click to enlarge )

Stag Industrial Inc (NYSE:STAG) breakout over $34.58 for a day trade.
( click to enlarge )

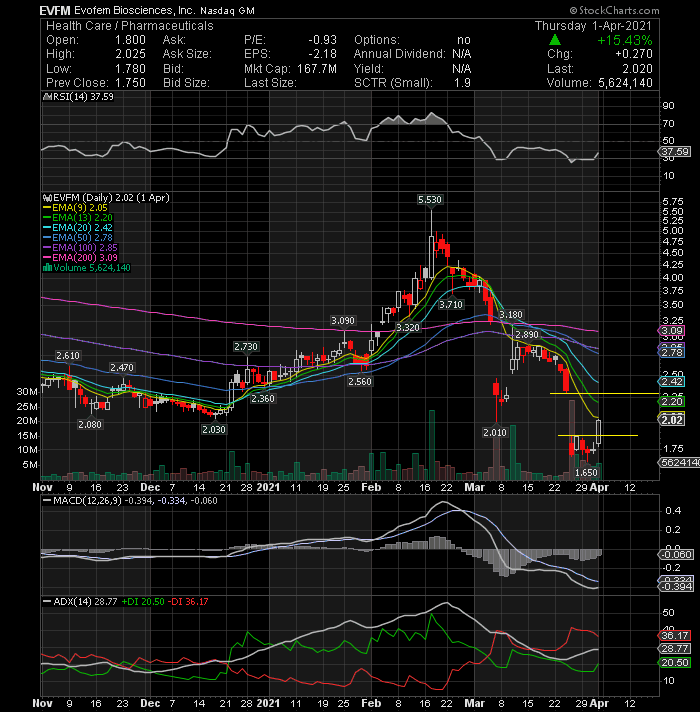
Evofem Biosciences Inc (NASDAQ:EVFM) Keeping my eye on this one. Nice candle yesterday on decent volume. Volume gap area.

During the day I tweet many times to my readers. I encourage everybody to subscribe AC Investor Blog twitter and newsletter, so you can receive my trade ideas and stock news in real time.

Disclaimer : This is not an investment advisory, and should not be used to make investment decisions. Information in AC Investor Blog is often opinionated and should be considered for information purposes only. No stock exchange anywhere has approved or disapproved of the information contained herein. There is no express or implied solicitation to buy or sell securities. The charts provided here are not meant for investment purposes and only serve as technical examples. Don't consider buying or selling any stock without conducting your own due diligence.

Thanks for visiting AC Investor Blog.

AC

Labels: , , , , , , , , , ,

Bookmark and Share

Sunday, May 31, 2020 

Trading Setups for the Coming Week

( click to enlarge )

Aethlon Medical, Inc. (NASDAQ:AEMD) at $1.47 a share looks to be putting in a bottom. It has been floating around this range for several trading sessions and I think the stock could see a sharp move higher from here. The daily indicators are beginning to turn bullish again. The MACD is still negative, but has crossed above its signal line. Both the RSI and slow stochastic are in their bullish zones. Chart is also  showing signs of significant share accumulation. I expect the share price to begin its ascent back to recent highs of 1.81 before ultimately breaking and surpassing $2 NOTE: Institutions have been increasing positions.

( click to enlarge )

I have already outlined the many reasons why I like Verastem Inc (NASDAQ:VSTM) in my twitter posts. At $1.86 this stock, in my view, offers a tremendous opportunity to profit in the short-term. What do the technical indicators say? The daily MACD is above the signal line in negative territory, but is rising. The RSI has climbed back above the 40% level and Slow Sto remains in neutral zone. The bottom looks to be in and the risk of more bloodshed is a lot lower than it was weeks, or even days ago. Im still long.

( click to enlarge )

People can say what they want about  Aikido Pharma Inc (NASDAQ:AIKI) and its past, but what matters is what is happening right now. Honestly, and based on the recent news the company is turning the corner and the stock is starting to reflect that (large base formation). At some point the investment community will catch onto this, until then I think AIKI is a true bargain. Its a Coronavirus play "Licensing Agreement with University of Maryland for Antiviral Compounds, Including COVID-19". It has been rangebound between 64c and 82c for almost six weeks. The last decline did not test the lower end of this range, creating a higher bottom. I would not be surprised to see this range to be broken soon and the stock make new swing highs. Im long.

( click to enlarge )

CleanSpark Inc (NASDAQ:CLSK) has the perfect set up to make another big run after a nice pullback. The break out point would be at 2.18. From a technical standpoint, the stock is trading above the major Hourly EMAs with all moving averages pointing upwards. In addition, the hourly MACD indicator is curling up also indicating a buy. The stock is in the process of bottoming. At some point it will explode to the upside. Let's keep an eye on her.

( click to enlarge )

Arcadia Biosciences Inc (NASDAQ:RKDA) has made a higher high at $5.32 and now has pulled back to its previous breakout level around 3.40. This key price zone has provided multiple support levels and is now showing signs of reversal. With continued buying pressure I am looking for this stock to hit and pass its $4 area next week.

( click to enlarge )

Virgin Galactic (NYSE:SPCE) had a great day on Friday. If the stock can break out above 17.74 with heavy volume, I think the stock could shoot up to test 21 level. There looks to be good upside potential, so watch the stock very closely on Monday.

( click to enlarge )

Digital Ally, Inc. (NASDAQ:DGLY) also had a very strong day on Friday, breaking out above the $1 level on heavy volume. As long as it can hold this level, it looks good. Technicals are showing bullish signals supported by positive MACD and A/D indicators.

( click to enlarge )

There is a potential breakout scenario developing on the daily chart of  Qualcomm (NASDAQ:QCOM). Buy signal: When stock breaks $82

( click to enlarge )

Elastic NV (NYSE:ESTC) Flagging nicely here. A breakout above $87.16 would constitute a technical entry for the short term trader looking for a quick trade. Daily technical indicators are in bullish zones. The stock price has been consolidating sideways within a rectangle pattern between 76 and 87 for the past 5 trading sessions. Rectangles, in this particular cases "bull flag" are usually continuation patterns, with price target implications. An expected upward breakout can take the stock to a target of 98. Since the stock is trading in a clear bull market (above all major EMAs), one can use the consolidation to accumulate with a stop-loss at 75.78

( click to enlarge )

Turkcell (NYSE:TKC) coming back for another test of resistance. Long over $5.20

( click to enlarge )

WWE (NYSE:WWE) appears to be forming an inverted head and shoulders pattern. The neckline is around $47 and if the daily candle gets a close above the neckline then the chart pattern is valid. Long setup on watch.

( click to enlarge )

FireEye, Inc.(NASDAQ:FEYE) Traders continued buying up this stock as it surged again on Friday this time to the tune of 4.48% on solid volume closing above its 100-day exp moving average. Daily technical indicators are in bullish zones. MACD is rising above its signal line in positive zone and RSI has climbed past their respective 50% level. Slow stochastic has entered its overbought zone. The stock warrants some attention next week.

( click to enlarge )

Blackberry (NYSE:BB) is one of my favorite long term plays and the technicals are setting up in favor of the bulls. The stock is now approaching a key medium-term resistance zone around 4.80 ( 100-day EMA). A move above this technical level is likely to spark a short-covering rally towards $5.20 BB is also heavy shorted which only means one thing, squeeze. Keep an eye on BB, near breakout levels.

During the day I tweet many times to my readers. I encourage everybody to subscribe AC Investor Blog twitter and newsletter, so you can receive my trade ideas and stock news in real time.

Disclaimer : This is not an investment advisory, and should not be used to make investment decisions. Information in AC Investor Blog is often opinionated and should be considered for information purposes only. No stock exchange anywhere has approved or disapproved of the information contained herein. There is no express or implied solicitation to buy or sell securities. The charts provided here are not meant for investment purposes and only serve as technical examples. Don't consider buying or selling any stock without conducting your own due diligence.

Thanks for visiting AC Investor Blog.

AC

Labels: , , , , , , , , , , , ,

Bookmark and Share

Sunday, September 15, 2019 

Here are a Few Trade Ideas for next week

( click to enlarge )

Plus Therapeutics Inc (NASDAQ:PSTV) Calling the bottom is always difficult, but in my opinion this chart is showing some positive momentum divergences, which often leads to short covering. A break of $10.08 with force next week might give room to $14. I entered long on Friday.

( click to enlarge )

Ameri Holdings Inc (NASDAQ:AMRH) should be on your radar screen next week. The company will host multiple customer events at SAP’s annual SuccessConnect conference, the premier event for human resources (HR) professionals, set to take place September 16-18 at the ARIA Resort & Casino in Las Vegas. On the technical side, daily indicators continue to show bullish momentum and the volume increased significantly. Looking to see if stock can get over 30c for a run to 49c

( click to enlarge )

Obalon Therapeutics Inc (NASDAQ:OBLN) price finally closed above the pivot high last week, breaking a descending channel that has been intact since the beginning of August. The Bullish sentiment and the huge short-interest could push the stock price to the nearest resistance of $3. The technical indicators are also sending Bullish signals and there is a gap to fill on chart. On watch.

( click to enlarge )

Qualcomm (NASDAQ:QCOM) tried to breakout above the $80.12 level last week but failed. Only a close above this level would suggest further upside.

( click to enlarge )

Prevail Therapeutics Inc (NASDAQ:PRVL) is possible trend reversal trade if it breaks $12 resistance area. The accumulation/distribution line is starting to curl upward, which should eventually lead to price increases. 

( click to enlarge )

Taronis Technologies Inc (NASDAQ:TRNX) we start to see now some signals of rebound as the technical chart shows positive momentum is back. Nearest resistance for the stock is at $2.31. If this level is crossed and the stock is able to sustain above this level, then it might go to $3.15

( click to enlarge )

Neurometrix Inc (NASDAQ:NURO) surged in the final hour of trading closing at 47c. The real fireworks should begin if the stock price can close above 50c. The accumulation line is starting to curl upward which should eventually lead to price increases. Keep it on your watch list going forward.

( click to enlarge )

I have  Scworx Corp (NASDAQ:WORX) on my watchlist again for next week. It might attempt to breakout above $4.34 level and if it succeed we should expect a strong move to the upside.

( click to enlarge )

Francesca's Holdings Corp (NASDAQ:FRAN) continue to show impressive strength as a near-term uptrend remains in place on the bar chart. The EMA20 on the 15 minutes chart has been a great support, so if you are long use it as a SL. Immediate resistance 19.49

( click to enlarge )

DavidsTea Inc (NASDAQ:DTEA) had a big pop on Friday and finally broke out of its major horizontal resistance line. Daily technical indicators are looking Bullish with the RSI indicator rising while the MACD is cutting above its signal line. Keep it on your watch list going forward. Pullbacks to 1.85-1.8 are buyable.

During the day I tweet many times to my readers. I encourage everybody to subscribe AC Investor Blog twitter and newsletter, so you can receive my trade ideas and stock news in real time.

Disclaimer : This is not an investment advisory, and should not be used to make investment decisions. Information in AC Investor Blog is often opinionated and should be considered for information purposes only. No stock exchange anywhere has approved or disapproved of the information contained herein. There is no express or implied solicitation to buy or sell securities. The charts provided here are not meant for investment purposes and only serve as technical examples. Don't consider buying or selling any stock without conducting your own due diligence.

Thanks for visiting AC Investor Blog.

AC

Labels: , , , , , , , , ,

Bookmark and Share

Tuesday, November 22, 2016 

My Watchlist for Wednesday, November 23

( click to enlarge )

Dynavax Technologies Corporation (NASDAQ:DVAX) has been bouncing nicely and is now trading in the gap zone. The bulls are stepping in as you can see by the uptrending of the accumulation indicator. Keep your eyes on this one, it has a nice gap to fill.

( click to enlarge )

Syntel, Inc. (NASDAQ:SYNT) had a nice move on the upside this afternoon and looks like it wants to go higher. Resistance stays at $20.47, which is a big area that the stock needs to break.

( click to enlarge )

I'm keeping an eye on ContraVir Pharmaceuticals Inc (NASDAQ:CTRV) for a breakout. A break of this large flag/pennant pattern could move the stock towards the $2.65 level. The stock looks pretty good holding above its EMA20. The EMA100 also just crossed above the EMA200 which is another positive bullish signal. This is a hot stock to watch.

( click to enlarge )

InspireMD Inc (NYSEMKT:NSPR) Super thin stock but daily chart looks good.

( click to enlarge )

Marinus Pharmaceuticals Inc (NASDAQ:MRNS) Building a base/bottoming the past four weeks. Lets see if it breaks over $1.25

( click to enlarge )

QUALCOMM, Inc. (NASDAQ:QCOM) is a stock to watch closely tomorrow. It has a big resistance range at 68.7/69.2, which is where we need it to break to make a big move. Keep an eye on it for a possible breakout.

If you want to contact me for advertising opportunities on blog or twitter, then get in touch via email

Disclaimer : This is not an investment advisory, and should not be used to make investment decisions. Information in AC Investor Blog is often opinionated and should be considered for information purposes only. No stock exchange anywhere has approved or disapproved of the information contained herein. There is no express or implied solicitation to buy or sell securities. The charts provided here are not meant for investment purposes and only serve as technical examples. Don't consider buying or selling any stock without conducting your own due diligence.

Thanks for visiting AC Investor Blog.

AC

Labels: , , , , ,

Bookmark and Share

Saturday, August 20, 2016 

My Watchlist for Monday, August 22

( click to enlarge )

Pandora Media Inc (NYSE:P) seems to have reversed from its short-term downtrend and could be starting a new uptrend. The daily technical chart shows that the stock has been exhibiting the bullish pattern of higher highs and high lows since early June. Let’s see whether the stock can gather enough momentum to break through the key $14.02 level next week.

( click to enlarge )

Cesca Therapeutics Inc (NASDAQ:KOOL) broke out of a base consolidation pattern on Hourly, as the stock closed up 28 cents on high volume. I will be watching it Monday for a continuation of this breakout. The short-term trend is still bullish as the stock is still on top of all EMAs. Other good news, the MACD is perking up and the ADX is moving up. I think the stock has room to go higher. If the stock can break Friday’s high of $4.23, we should see a strong follow through move. Next resistance levels are $4.40 and then $6.50

( click to enlarge )

QUALCOMM, Inc.(NASDAQ:QCOM) is trading a very tight range and should make a move soon. The stock is developing a bull flag and the breakout should be a nice one if it can hold up. Keep an eye on QCOM as it is starting to tick up. The stock is in a bull market and should continue to go up as both 100 day and 200 day exp moving averages are heading up. At this stage it is definitely a wait and see if the resistance will be easily taken out by the bulls.

( click to enlarge )

First Solar, Inc. (NASDAQ:FSLR) From a technical standpoint, it looks like a bottom formation here. There are some signs of a possible bounce at this point due to oversold indicators and some positive divergences, which often leads to short covering. Let’s see whether the stock can gather enough momentum to break through the $38.30 level. I started a long position.

( click to enlarge )

ZIOPHARM Oncology Inc. (NASDAQ:ZIOP) is also recovering. Resistance is formed at 6.24 and a potential break should open the door for further gains to 7. I remain bullish for now, the 5.6/5.66 area should hold any weakness. Worth watching going forward.

( click to enlarge )

EnteroMedics Inc (NASDAQ:ETRM) is a penny stock to watch. The stock is catching the attention of market players after the Monday news. The company announced the publication of 24 month results from the Company's ReCharge Clinical Study. The article, titled "Two-Year Outcomes of Vagal Nerve Blocking (vBloc) for the Treatment of Obesity in the ReCharge Trial," was published in Obesity Surgery. The authors ofthis article noted that the safety profile of vBloc Therapy remained favorable at 24 months compared to complications observed with conventional bariatric procedures such as sleeve gastrectomy and gastric bypass. ETRM rallied +12.7% to close at 21c and traded massive volume action of 22M shares. Its technical daily chart shows some bullish signals as +DI is now going up and the MACD just crossed above the signal line. With this daily chart bull signal its very possible that we could see a continuation next week. Something must be up with this stock, but I urge you not to buy a significant portion of your trading capital, because this is a penny stock, so be careful with the position size.

( click to enlarge )

Alibaba Group Holding Ltd (NYSE:BABA) watch for a possible breakout of current consolidation (pennant formation).

( click to enlarge )

Citigroup Inc (NYSE:C) could accelerate toward 47.43-47.62 zone if it breaks 46.80 resistance.

Now that the Stockal app has settled down somewhat, let me talk about an interesting new feature these guys are launching in early September. Stockal will soon give you the ability to add multiple brokerage accounts into Stockal to see a unified view of your overall portfolio. So if you have an account with, say, TD Ameritrade and another with Fidelity - you can bring both into Stockal to get all your stocks in one place. Once you do that, Stockal will keep an eye on ALL your stocks and alert you whenever any of those need your attention. For instance, if there is an analyst upgrade or downgrade on any of your stocks, Stockal will let you know. Or if a stock's sentiment falls or many people are discussing the stock for some reason, Stockal can inform you. Having all accounts together in one place is also good 'coz your total invested capital and its total net worth will be visible to you all the time, in one place! Plus if you want to sell one of your stocks, Stockal will be able to seamlessly place your order via the brokerage account that you have that particular stock in. Cool, right? Just download the iOS app so that you get this feature on the next update.

Disclaimer : This is not an investment advisory, and should not be used to make investment decisions. Information in AC Investor Blog is often opinionated and should be considered for information purposes only. No stock exchange anywhere has approved or disapproved of the information contained herein. There is no express or implied solicitation to buy or sell securities. The charts provided here are not meant for investment purposes and only serve as technical examples. Don't consider buying or selling any stock without conducting your own due diligence.

Thanks for visiting AC Investor Blog.

AC

Labels: , , , , , , ,

Bookmark and Share

Saturday, May 21, 2016 

Bullish list of setups for Next Week

( click to enlarge )

QUALCOMM, Inc.(NASDAQ:QCOM), after nearly three months of consolidation in the 49.75-53.4 area stock finally broke out on Friday and took out its critical level of $53.04 (200-day EMA). The break of this key resistance line confirms a short-term trend reversal and the beginning of new momentum, which could move the stock above the $56 area. Daily technical indicators are looking bullish. The daily MACD is rising above its signal line in positive territory and the RSI is above its 50% level. This momentum could push this stock much higher from here, so keep it on the radar next week.

( click to enlarge )

Pandora Media Inc (NYSE:P) A short squeeze on the horizon? This stock has surged in recent weeks amid strong volume and closed the week above its declining 100-day EMA for the first time since December 2015. With almost 22% of the float short or 49.5M shares, I think this stock is due for a big move higher. On the technical side, the short-term daily chart remains bullish. The stock is trading above all major short-term EMAs but below its 200-day EMA. Plus, the MACD is positive/rising and the On balance volume shows strong accumulation. If the stock can break through $11.50 resistance next week, we should see another strong upside move. P will move very quickly, so watch the stock closely.

( click to enlarge )

Cadence Design Systems Inc (NASDAQ:CDNS) broke out to new highs on high volume. The uptrend remains intact and signals further bullishness on this stock. Daily technical indicators are bullish.

( click to enlarge )

Fitbit Inc (NYSE:FIT) looks to have bottomed. The stock broke the $14.39 resistance level Friday on solid volume and could eventually rally up to test its gap resistance. Daily technical indicators are beginning to turn bullish. Let’s see whether the stock can gather enough momentum to break through $15 next week.

( click to enlarge )

Acacia Research Corp (NASDAQ:ACTG) is in a bullish formation. A break through this 5.06 area could accelerate it higher. Insiders have been very aggressive buyers here.

( click to enlarge )

Keep an eye on Rambus Inc. (NASDAQ:RMBS). If the stock breaks above its 20-day EMA on heavy volume next week, then we will know the next major move up is likely. The MACD has already triggered a bullish signal, as it curved upward and crossed above its signal line last week, while RSI is also gaining strength. I do not see any resistance on the chart until $12.30.

( click to enlarge )

Cellectar Biosciences Inc (NASDAQ:CLRB) saw its shares surged almost 232% to $3.45 per share on massive volume Friday after revealed that the company got patent identification numbers for its Phospholipid-Ether Analogs as Cancer Targeting Drug Vehicles. On the weekly chart, the stock has a strong resistance around $4, and a break above it should lead to a continued advance up to 5.20, the next strong resistance level.

( click to enlarge )

Ithink BlackBerry Ltd (NASDAQ:BBRY) is building a nice base for take off. Some daily technical indicators are showing positive divergences. Next resistance is located at $6.93, while immediate support has moved up to $6.56

Last week I mentioned that you could use the Stockal-mobile app to track your stock investments on-the-go. Nice to see a lot of my readers have downloaded and are using the app. I would love to know what you thought about it. This is a young team trying to make something useful and any feedback will help them. For those who haven't used it -Stockal helps you discover volatile stocks all the time on the basis of analyst ratings, sentiment changes, news and social media conversations. Covering over 6,000 stocks, "Stockal" tries to make your investing decisions easy by giving you pretty much everything you want to know about a stock. For every stock out there - it gets you Analyst Confidence (from Wall St. firms), News & Sentiment, Analyst Reports, curated Social media chatter (Twitter, StocksTwits etc) and Revenue Predictions (for future quarters). You can also invite your peers/friends/experts for a chat on Stockal. And I have come to know that these guys are also adding multiple brokerages right into the app. So if you have an account with TD Ameritrade, E*Trade, Scottrade, Fidelity etc, you can buy/sell stocks on Stockal using just the login credentials of your brokerage account - just like you swipe your card at the Amazon website. 


Thank you so much for those who helps me to reach 16000 followers on twitter !!!!

During the day I tweet many times to my readers. I encourage everybody to subscribe AC Investor Blog  twitter and newsletter, so you can receive my trade ideas and stock news in real time. 

Disclaimer : This is not an investment advisory, and should not be used to make investment decisions. Information in AC Investor Blog is often opinionated and should be considered for information purposes only. No stock exchange anywhere has approved or disapproved of the information contained herein. There is no express or implied solicitation to buy or sell securities. The charts provided here are not meant for investment purposes and only serve as technical examples. Don't consider buying or selling any stock without conducting your own due diligence.

Thanks for visiting AC Investor Blog.

AC

Labels: , , , , , , ,

Bookmark and Share
Contact

About Me

    Photobucket
  • I'm a 48 year old Independent Trader using proprietary technical analysis with more than 20 years experience of investing in the US stock markets. I started this blog in 2006 simply as a way to share my thoughts about capital, risk management, and trading. My blog contains only my personal opinion and is provided for informational purposes only.

  • Benzinga.com supporter

    Benzinga.com supporter


    FREE NEWSLETTER

      Enter your email address:

      Delivered by FeedBurner

      Subscribe my feed :

    Support AC

    • Support AC Investor Blog, Donate with PayPal

    Advertising

      Interested in advertising on AC Investor Blog ? Click Here

    TRANSLATOR

    Site Information

    Stock Market Blogroll

    Friends BLOGROLL

    ARCHIVES

Powered by Blogger
and Blogger Templates


Add to Google


