-Financial Tools Futures Market--TRADE IDEAS-- OPTION ALERTS -BENZINGA PRO-

Saturday, April 10, 2021 

Ten symbols with interesting patterns to trade next week


( click to enlarge )

PVH (NYSE:PVH) is a candidate to be traded in breakout mode. The technical indicators are looking better for the stock with MACD indicator above its sell signal line, %K line on top of %D line and RSI indicator moving up from the 50 level. Keep an eye for a possible breakout over $110.89

( click to enlarge )

We are on the verge of a  possible trend reversal trade setup in the shares of Macy's (NYSE:M) after a healthy consolidation. The stock looks like it could be getting ready to go! Good technical and decent fundamentals here. The stock is worth a close look.

( click to enlarge )

My new big pick is Odonate Therapeutics Inc (NASDAQ: ODT). The stock made an awesome move yesterday breaking out of a major resistance line with volume backed confirmation. I went long at $3.85 as it's quite possible we should see a short term move near $4.97/share. The technical chart shows a bullish sign with %K line on top of %D line and MACD rising. Yesterday’s action in the share price leads me to believe that we may see a reversal trend at this level. To sustain this point of view, stock needs to sustain actual level in the days to come, so stay tuned to her. Mega Gap to fill here.

( click to enlarge )

Pyxis Tankers Inc (NASDAQ:PXS) is one for the bottom pickers. Upside volume is picking up and a rounding bottom is taking shape. I have been following and accumulating this stock for a few days now. The trend should resume back up in the very near future. I could be wrong, but I did not find a reason for the drop in shares as it did. It was likely a consequence of the negative market environment in the small cap index. Consider shares to be at a bit of a discount if my speculation is correct.  And honestly I have a lot of confidence regarding this.

( click to enlarge )

aTyr Pharma Inc (NASDAQ:LIFE) is beginning to make a move higher. Yesterday's fight toward the 20-EMA could represent the start of a larger trend change. Key resistance is located at $4.68, a break above this level will confirm the bullish trend and the following uptrend will take the price up to the $5.5 zone

( click to enlarge )

A move on  Fubotv Inc (NYSE:FUBO) above $26.2 could spark a nice short-squeeze next week. Looking at the technical daily chart there are several indications I see which suggest a potential bottom formation, including large positive divergences on MACD in daily. If the potential buy signal confirms itself, we will be looking for a move to the resistance area at $33.3-34.72, at the very least. Until that happens, traders will want to be on high-alert to the possibility of a bullish reversal. Long setup on watch.

( click to enlarge )

Building a nice falling wedge, holding above EMA100. A move on  Wisekey International Holding AG (NASDAQ:WKEY) above $12 could spark a nice short-squeeze. The stock will move very quickly, so watch the stock very closely over the next few trading sessions.

( click to enlarge )

I'm watching ATA Creativity Global (NASDAQ:AACG) again as the stock looks to be setting up for a big upside move in line with the other EDU China stocks. Potential upside of 60% exists for the stock, based on a current level of $4.06 and analysts' average consensus price target of $6.50. The stock should find initial resistance at $4.14 and further resistance at its 20-day EMA of $4.32

( click to enlarge )

Greenpro Capital Corp (NASDAQ:GRNQ) With Bitcoin making new highs, this stock should be in your watchlist on Monday. A break above 3.18 will impart bullishness and will help the stock move to the short-term target zone of the 3.75-4.1 range.

( click to enlarge )

Riot Blockchain Inc (NASDAQ:RIOT) Love this triangle formation on 4h chart. Needs to break out either side to see significant moves.

During the day I tweet many times to my readers. I encourage everybody to subscribe AC Investor Blog twitter and newsletter, so you can receive my trade ideas and stock news in real time.

Disclaimer : This is not an investment advisory, and should not be used to make investment decisions. Information in AC Investor Blog is often opinionated and should be considered for information purposes only. No stock exchange anywhere has approved or disapproved of the information contained herein. There is no express or implied solicitation to buy or sell securities. The charts provided here are not meant for investment purposes and only serve as technical examples. Don't consider buying or selling any stock without conducting your own due diligence.

Thanks for visiting AC Investor Blog.

AC

Labels: , , , , , , , , ,

Bookmark and Share

Friday, April 02, 2021 

Stock market swing trade ideas for the week ahead


( click to enlarge )

Pyxis Tankers Inc (NASDAQ:PXS) has witnessed an excellent uptick overall during the past few sessions and it has been correlated with increasing volume. The stock closed 8.74% higher to 1.12 on Thursday after consolidating over 1 week within a narrow range. Considering the recent increase in volume, accumulation and money flow, I believe PXS could make a solid move higher given both its fundamental and technical factors. Momentum picking up with MACD climbing and RSI rising. In the past, PXS has experienced surges in valuation of over 50% in just days. MACD History on the chart above repeats for itself. Keep a close eye on PXS next week because it could be a strong play.

( click to enlarge )

Houston American Energy Corporation (NYSEAMERICAN:HUSA) shares decreased nearly 50% from a couple weeks ago after making a big uptick. Now share prices are ready to make a solid move, since it has started recovering from its rising EMA200 support zone. Additionally, its accumulation remains very high during the consolidation phase which is a very positive sign. So don't ignore it, consider taking advantage of the situation before the crowd. The daily MACD histogram has started to diverge positively and RSI is turning up. HUSA is another small Oil play that needs to be at the top of your watchlist next week.

( click to enlarge )

 CASI Pharmaceuticals Inc (NASDAQ:CASI) moved up about 9.22% on strong volume last week and it looks like a lot of traders booked gains from the upwards run, but I did exactly the opposite. With the resistance level already identified on the charts and with the huge insider activity revealed, I used the pullback to take a big long position. Usually when insiders buy shares, especially in large amounts it is a sign that positive things are coming. If CASI can keep going up and break the resistance at 2.50 this could further confirm the uptrend and would give a measured move target of nearly 3.25

( click to enlarge )

WISeKey International Holdings ADR (NASDAQ:WKEY) This NFT play is worth watching here.There is a positive MACD divergence on the hourly chart and this usually means that an upward movement is coming. On watch.

( click to enlarge )

Greenpro Capital Corp (NASDAQ:GRNQ) Some serious upside volume coming into this stock over the last few days. Correction is very flat and is showing me that the buying pressure remains strong. Look at the big volume bars. That is serious accumulation. Bullish continuation is very probable IMHO if it breaks 3.30 next week, the move could be explosive.

( click to enlarge )

Qualcomm (NASDAQ:QCOM) price broke out of a bottom pattern. Long entry triggered first target 142.85 From a technical standpoint, the stock has an up trending MACD, indicating potential accumulation and an up-trending RSI at 55 indicating room for potential further gains.

( click to enlarge )

The technical chart of Thomson Reuters Corp (NYSE:TRI) looks fairly appealing for a possible short term trade. The stock price is forming an ascending triangle pattern on a daily. If price breaks out above 89.69 then we should probably see a significant move to the upside next week.

( click to enlarge )

Hartford Financial Services Group Inc (NYSE:HIG) in another box (flagging), wait for the break.

( click to enlarge )

Camber Energy Inc (NYSEAMERICAN:CEI) Price should become explosive if this chart pattern is broken to the upside with volume. I want to go long this stock on a move above $1.14 for a day trade.

( click to enlarge )

Stag Industrial Inc (NYSE:STAG) breakout over $34.58 for a day trade.

( click to enlarge )

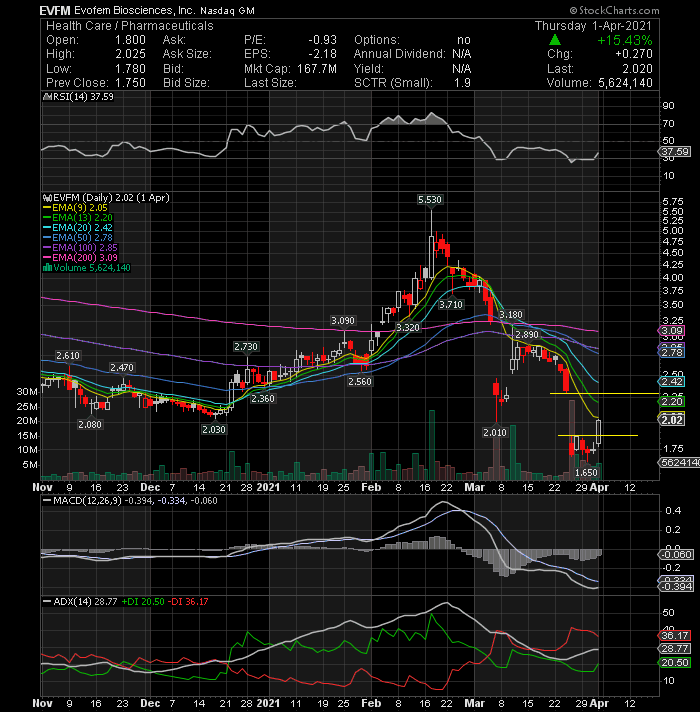
Evofem Biosciences Inc (NASDAQ:EVFM) Keeping my eye on this one. Nice candle yesterday on decent volume. Volume gap area.

During the day I tweet many times to my readers. I encourage everybody to subscribe AC Investor Blog twitter and newsletter, so you can receive my trade ideas and stock news in real time.

Disclaimer : This is not an investment advisory, and should not be used to make investment decisions. Information in AC Investor Blog is often opinionated and should be considered for information purposes only. No stock exchange anywhere has approved or disapproved of the information contained herein. There is no express or implied solicitation to buy or sell securities. The charts provided here are not meant for investment purposes and only serve as technical examples. Don't consider buying or selling any stock without conducting your own due diligence.

Thanks for visiting AC Investor Blog.

AC

Labels: , , , , , , , , , ,

Bookmark and Share

Saturday, March 06, 2021 

Some potential bounce plays to keep an eye on


( click to enlarge )

I think Tesla, Inc. (NASDAQ:TSLA) will have a relief rally next week after its dramatic fall since the January peak of $900. The RSI history of this stock speaks louder. Notice that everytime the daily RSI drops below the 30% level, the stock makes a dramatic rise in the weeks after. The performance history of a stock is always an important parameter in my technical analysis. Nowadays, a lot of traders sell any stock when the daily RSI touches 70 and buy when it falls to 30, however, you must analyze the RSI history before making any trade. History does tend to repeat itself and the majority of the stocks have more than one life in them. Another interesting factor on this long-term chart is that the uptrend of the accumulation line remains practically intact after this big drop, which means the stock is still on the positive swing. These are few reasons why I think now is the time to take a long position at this one, before the stock changes its trend and heads back higher. The bottom looks to be in and the risk of more bloodshed is a lot lower than it was weeks days ago. Lets see if I am right again. NOTE: I took a significant long position on Tesla last week. I won't share my stop loss to avoid algorithms reading it.

( click to enlarge )

Applied UV Inc (NASDAQ:AUVI) with such a great trading day and news, this stock should be closely watched next week. I think there is a good chance for further gains as this stock went from much lower prices, 5 to $35.78 just last month. Could we see that type of rally again? That is the best thing about this market, anything is possible. Yesterday, SteriLumen tweeted that the LEDs in their devices have been proven to kill Coronavirus in seconds. Thats a remarkable argument in pandemic times, which could easily boost its sales. From a technical standpoint, the stock has been consolidating within a falling wedge pattern on H2 that has bullish implications. A breakout is needed to end this large consolidation and resume the uptrend. At this point I'm inclined to mark a key resistance zone around 9.5- 9.75. A move above this area, would break the upper trendline and the resistance zone. If a breakout occurs, we could see an acceleration of the bullish momentum and move toward the 13.75-15 area. Technical indicators are looking bullish, MACD and RSI are showing upward momentum. Now add the bottom play factor along with Yesterday's positive tweet and the potential upwards move gets a little more believable. I doubled my long position before the close.

( click to enlarge )

OLB Group Inc (NASDAQ:OLB) a great trading session and the late last minute buying spree bodes well for next week. Last week the company issued two press releases that were not seriously taken in consideration due to the market behavior. If the market stabilizes next week at these levels and the growth uncertainty reduces, small-caps may outperform and this one could easily run to +$8 again. A break of the $6.54 level could bring $8 and then $8.80 quickly into focus.

( click to enlarge )

Churchill Capital Corp IV  (NASDAQ:CCIV) appears to have bottomed and I think it will turn higher in the short term. Keep a close eye on the stock, as it could break out from here. Breakout watch over 24.98

( click to enlarge )

A quick look at GRNQ's chart will show a stock that has been on the downfall for the last three weeks. Yesterday, the stock held nicely its rising EMA200 meaning we could be seeing at least a temporary bottom. I wouldn't be surprised if this stock popped 15-20% in one session soon.

( click to enlarge )

This spec Oil name New Concept Energy, Inc. (NYSEAMERICAN:GBR) hit a new one-month low yesterday and started to bounce off of them. This should continue next week and we could see a very sharp recovery. GBR was a high flyer later in January. Currently is a good stock to trade, not for investment.

( click to enlarge )

I do believe Camber Energy Inc (NYSEAMERICAN:CEI) will bounce and with continued positive crude Oil news that bounce will turn into a significant trend higher. Add this merger/spec Oil name to your watchlist, this is a knife worth catching.

( click to enlarge )

I think it's fair to say at this stage FSD Pharma Inc (NASDAQ:HUGE) is way undervalued and that the selling has gone far beyond reason. I think a $1.80 break would be very bullish for this stock for a quick run to 2.40

During the day I tweet many times to my readers. I encourage everybody to subscribe AC Investor Blog twitter and newsletter, so you can receive my trade ideas and stock news in real time.

Disclaimer : This is not an investment advisory, and should not be used to make investment decisions. Information in AC Investor Blog is often opinionated and should be considered for information purposes only. No stock exchange anywhere has approved or disapproved of the information contained herein. There is no express or implied solicitation to buy or sell securities. The charts provided here are not meant for investment purposes and only serve as technical examples. Don't consider buying or selling any stock without conducting your own due diligence.

Thanks for visiting AC Investor Blog.

AC

Labels: , , , , , , ,

Bookmark and Share

Saturday, January 23, 2021 

Twelve Stocks on my watchlist for the 4th week of the year


( click to enlarge )

GameStop (NYSE:GME) is on the watch list because I still enjoy watching it trade. As you know, I took a short position last week and increased on Friday because there are no fundamentals to support such a rally, and I'm almost sure that will end badly for a lot of newbie traders that are not aware of how the stock market works in euphoric times. Investors who buy on hype can be left holding the bag. GME remains a highly liquid, volatile stock that can be utilized to make quick profits. There is nothing wrong playing this stock, as there will be a firm bunch of believers buying into this hype, but be sure not to be holding this when the music stops, and the chart seems to be saying that the music is about to STOP. If you're new to trading, avoid this battle between giants where only you will lose, they know very well when to exit, you not. I'm currently losing on my short-trade, but this article is just to help you, because in the past I was also a victim of these schemes. The stock is very overpriced for the results it delivers. Please consider this a friendly message. Never believe the hype. Enjoy it, But never believe it. Just trade it and you’ll do just fine. From a technical standpoint, the stock is very overbought and overhyped. The stock will fall sooner than later. The RSI history speaks louder. Notice that everytime the RSI hits near 90 it drops. I would like to end this article saying that i know how to manage a losing trade, but most of you do not. Don't be greedy / play smart. Good luck all.

( click to enlarge )

BlackBerry (NYSE:BB) continues to perform incredibly well despite some market undercertainity. I'm still holding my long-term investment in the company. Discipline, knowledge and focus never hurt anyone. Looking for a possible run to $20.....When you see volume creeping in and a slow steady price rise the alarms should start to sound.

( click to enlarge )

Socket Mobile, Inc. (NASDAQ:SCKT) is quietly heading higher. We all know what can happen with this stock when it gets some momentum behind it. The stock broke the downtrend line from the October peak of $4.50, which sets the stage for additional gains. I do think $3.75 is a possibility short term. Add it to your watch list.

( click to enlarge )

AMC Entertainment Holdings Inc (NYSE:AMC) is a stock to add to your watch list. With over 268 million shares trading hands on Friday, the stock is sure to get some attention going forward. The last time AMC ran it hit $5 a share. History does tend to repeat itself. Long setup on watch.

( click to enlarge )

Novavax, Inc. (NASDAQ:NVAX) closed the Friday session strong right near the high of the day. I think this stock could see $150 next week. Last night after the market's close, the company announced that it has finalized an agreement with the Government of Canada to supply up to 76M doses of NVX-CoV2373, the company's recombinant protein-based COVID-19 vaccine. Canada has committed to purchase 52M doses of the vaccine with the option for up to an additional 24M doses. NVX-CoV2373 is currently in Phase 3 clinical development for the prevention of COVID-19. The company expects to supply NVX-CoV2373 to Canada beginning as early as the second quarter of 2021, following authorization by Canada's regulatory agency.  Looking at the daily technical daily chart the near-term outlook is positive. Momentum indicators are starting to point up, which is a sign of growing strength in the stock and MACD is also giving a positive indication. NVAX will move quickly, so keep it on your screen on Monday.

( click to enlarge )

Greenpro Capital Corp (NASDAQ:GRNQ) had a promising day trying to regain some traction yesterday. I think this Bitcoin play could be setting itself up for another nice run short-term. Closed up 6.22% on solid volume in what may be the start of an explosive reversal. Could pop over 2.12 , definitely on watch next week.

( click to enlarge )

Sundial Growers Inc (NASDAQ:SNDL) looks to have bottomed and could post another strong move higher. I'd add this one to your watchlist again and keep a close eye on the volume. Increased buying pressure should push this stock up in a big way. My price target stays at $1

( click to enlarge )

Cardiff Oncology Inc (NASDAQ:CRDF) Possible double bottom pattern. I think this stock has found support around the $10.3-$11 range and looks poised to post a bounce from here. I could see a 20-30% possible bounce up to $16 a share if it can close abv $12.50

( click to enlarge )

Color Star Technology Co Ltd (NASDAQ:CSCW) closed back above its 200-day exponential moving average on Friday. This stock is under some impressive accumulation as of late. I think a burst to $1.02 is in the cards short term. A longer term buying scenario could see this stock trading at $1.43 or better.

( click to enlarge )

Kodak (NYSE:KODK) appears ready to embark on another trip over $10 a share. This time should be different and I would expect the stock to hold its gains.

( click to enlarge )

We’re keeping the momentum going. Congrats to those that took full advantage of my pick yesterday, Molecular Data Inc (NASDAQ:MKD). The stock closed up 72% on monstrous 134M shares traded. Watch the break of $1.69 next week for continuation to $1.95

( click to enlarge )

Enveric Biosciences Inc (NASDAQ:ENVB) this $3.94 stock is also looking to make a move higher off its recent bottom. This was a stock that was trading at over $15 a share a few days ago. A reasonable bounce target is $6

During the day I tweet many times to my readers. I encourage everybody to subscribe AC Investor Blog twitter and newsletter, so you can receive my trade ideas and stock news in real time.

Disclaimer : This is not an investment advisory, and should not be used to make investment decisions. Information in AC Investor Blog is often opinionated and should be considered for information purposes only. No stock exchange anywhere has approved or disapproved of the information contained herein. There is no express or implied solicitation to buy or sell securities. The charts provided here are not meant for investment purposes and only serve as technical examples. Don't consider buying or selling any stock without conducting your own due diligence.

Thanks for visiting AC Investor Blog.

AC

Labels: , , , , , , , , , ,

Bookmark and Share
Contact

About Me

    Photobucket
  • I'm a 48 year old Independent Trader using proprietary technical analysis with more than 20 years experience of investing in the US stock markets. I started this blog in 2006 simply as a way to share my thoughts about capital, risk management, and trading. My blog contains only my personal opinion and is provided for informational purposes only.

  • Benzinga.com supporter

    Benzinga.com supporter


    FREE NEWSLETTER

      Enter your email address:

      Delivered by FeedBurner

      Subscribe my feed :

    Support AC

    • Support AC Investor Blog, Donate with PayPal

    Advertising

      Interested in advertising on AC Investor Blog ? Click Here

    TRANSLATOR

    Site Information

    Stock Market Blogroll

    Friends BLOGROLL

    ARCHIVES

Powered by Blogger
and Blogger Templates


Add to Google