-Financial Tools Futures Market--TRADE IDEAS-- OPTION ALERTS -BENZINGA PRO-

Sunday, May 31, 2020 

Trading Setups for the Coming Week

( click to enlarge )

Aethlon Medical, Inc. (NASDAQ:AEMD) at $1.47 a share looks to be putting in a bottom. It has been floating around this range for several trading sessions and I think the stock could see a sharp move higher from here. The daily indicators are beginning to turn bullish again. The MACD is still negative, but has crossed above its signal line. Both the RSI and slow stochastic are in their bullish zones. Chart is also  showing signs of significant share accumulation. I expect the share price to begin its ascent back to recent highs of 1.81 before ultimately breaking and surpassing $2 NOTE: Institutions have been increasing positions.

( click to enlarge )

I have already outlined the many reasons why I like Verastem Inc (NASDAQ:VSTM) in my twitter posts. At $1.86 this stock, in my view, offers a tremendous opportunity to profit in the short-term. What do the technical indicators say? The daily MACD is above the signal line in negative territory, but is rising. The RSI has climbed back above the 40% level and Slow Sto remains in neutral zone. The bottom looks to be in and the risk of more bloodshed is a lot lower than it was weeks, or even days ago. Im still long.

( click to enlarge )

People can say what they want about  Aikido Pharma Inc (NASDAQ:AIKI) and its past, but what matters is what is happening right now. Honestly, and based on the recent news the company is turning the corner and the stock is starting to reflect that (large base formation). At some point the investment community will catch onto this, until then I think AIKI is a true bargain. Its a Coronavirus play "Licensing Agreement with University of Maryland for Antiviral Compounds, Including COVID-19". It has been rangebound between 64c and 82c for almost six weeks. The last decline did not test the lower end of this range, creating a higher bottom. I would not be surprised to see this range to be broken soon and the stock make new swing highs. Im long.

( click to enlarge )

CleanSpark Inc (NASDAQ:CLSK) has the perfect set up to make another big run after a nice pullback. The break out point would be at 2.18. From a technical standpoint, the stock is trading above the major Hourly EMAs with all moving averages pointing upwards. In addition, the hourly MACD indicator is curling up also indicating a buy. The stock is in the process of bottoming. At some point it will explode to the upside. Let's keep an eye on her.

( click to enlarge )

Arcadia Biosciences Inc (NASDAQ:RKDA) has made a higher high at $5.32 and now has pulled back to its previous breakout level around 3.40. This key price zone has provided multiple support levels and is now showing signs of reversal. With continued buying pressure I am looking for this stock to hit and pass its $4 area next week.

( click to enlarge )

Virgin Galactic (NYSE:SPCE) had a great day on Friday. If the stock can break out above 17.74 with heavy volume, I think the stock could shoot up to test 21 level. There looks to be good upside potential, so watch the stock very closely on Monday.

( click to enlarge )

Digital Ally, Inc. (NASDAQ:DGLY) also had a very strong day on Friday, breaking out above the $1 level on heavy volume. As long as it can hold this level, it looks good. Technicals are showing bullish signals supported by positive MACD and A/D indicators.

( click to enlarge )

There is a potential breakout scenario developing on the daily chart of  Qualcomm (NASDAQ:QCOM). Buy signal: When stock breaks $82

( click to enlarge )

Elastic NV (NYSE:ESTC) Flagging nicely here. A breakout above $87.16 would constitute a technical entry for the short term trader looking for a quick trade. Daily technical indicators are in bullish zones. The stock price has been consolidating sideways within a rectangle pattern between 76 and 87 for the past 5 trading sessions. Rectangles, in this particular cases "bull flag" are usually continuation patterns, with price target implications. An expected upward breakout can take the stock to a target of 98. Since the stock is trading in a clear bull market (above all major EMAs), one can use the consolidation to accumulate with a stop-loss at 75.78

( click to enlarge )

Turkcell (NYSE:TKC) coming back for another test of resistance. Long over $5.20

( click to enlarge )

WWE (NYSE:WWE) appears to be forming an inverted head and shoulders pattern. The neckline is around $47 and if the daily candle gets a close above the neckline then the chart pattern is valid. Long setup on watch.

( click to enlarge )

FireEye, Inc.(NASDAQ:FEYE) Traders continued buying up this stock as it surged again on Friday this time to the tune of 4.48% on solid volume closing above its 100-day exp moving average. Daily technical indicators are in bullish zones. MACD is rising above its signal line in positive zone and RSI has climbed past their respective 50% level. Slow stochastic has entered its overbought zone. The stock warrants some attention next week.

( click to enlarge )

Blackberry (NYSE:BB) is one of my favorite long term plays and the technicals are setting up in favor of the bulls. The stock is now approaching a key medium-term resistance zone around 4.80 ( 100-day EMA). A move above this technical level is likely to spark a short-covering rally towards $5.20 BB is also heavy shorted which only means one thing, squeeze. Keep an eye on BB, near breakout levels.

During the day I tweet many times to my readers. I encourage everybody to subscribe AC Investor Blog twitter and newsletter, so you can receive my trade ideas and stock news in real time.

Disclaimer : This is not an investment advisory, and should not be used to make investment decisions. Information in AC Investor Blog is often opinionated and should be considered for information purposes only. No stock exchange anywhere has approved or disapproved of the information contained herein. There is no express or implied solicitation to buy or sell securities. The charts provided here are not meant for investment purposes and only serve as technical examples. Don't consider buying or selling any stock without conducting your own due diligence.

Thanks for visiting AC Investor Blog.

AC

Labels: , , , , , , , , , , , ,

Bookmark and Share

Monday, September 25, 2017 

My Watchlist for Tuesday, Sept 26

( click to enlarge )

Inpixon (NASDAQ:INPX) rocketed out the gates like a bullet with over 70%. Congrats everyone who bought this name when I put out an alert on twitter ( around the 25c level) this afternoon. Next pivot points are 39c and 47c.

( click to enlarge )

Corcept Therapeutics Incorporated (NASDAQ:CORT) broke out and never stopped all day. There is a good chance the stock will continue to move up in the next sessions.

( click to enlarge )

Marinus Pharmaceuticals Inc (NASDAQ:MRNS) stock hit a new high and continues to draw interest. As long as the stock stays above the $5 level, the short-term bullish scenario still intact.

( click to enlarge )

Innodata Inc (NASDAQ:INOD) this AI play should be in your watchlist for tomorrow. The stock traded high volume today. This sector is on FIRE and it has a lot of potential to be a big percentage mover, like INPX or IZEA.

( click to enlarge )

FireEye Inc (NASDAQ:FEYE) Flagging above the breakout area. Long setup.

( click to enlarge )

GoPro Inc (NASDAQ:GPRO) still acting well in comparison to the rest of the market. We might retest or break the recent highs soon.

If you want to contact me for advertising opportunities on blog or twitter, then get in touch via email

Disclaimer : This is not an investment advisory, and should not be used to make investment decisions. Information in AC Investor Blog is often opinionated and should be considered for information purposes only. No stock exchange anywhere has approved or disapproved of the information contained herein. There is no express or implied solicitation to buy or sell securities. The charts provided here are not meant for investment purposes and only serve as technical examples. Don't consider buying or selling any stock without conducting your own due diligence.

Thanks for visiting AC Investor Blog.

AC

Labels: , , , , ,

Bookmark and Share

Sunday, September 10, 2017 

My Watchlist for Monday, Sept 11

Hey everyone, I'm back in business! Here is a list of stocks to watch that caught my eye based purely on technical analysis.

( click to enlarge )

FireEye Inc (NASDAQ:FEYE) share price could be heading for a breakout in the coming days. Any close above the top of this trading range can indicate that the next leg of the rally could go up to the 18.50 level.

( click to enlarge )

Verastem Inc (NASDAQ:VSTM) continues to show tremendous strength. I really believe this stock has a good chance to move above $6 any time soon. On wednesday, Cantor Fitzgerald upgraded the shares from Neutral to Overweight with a price target of $17. On watch.

( click to enlarge )

Pandora Media Inc (NYSE:P) is gaining some momentum again. The stock closed the week above all short-term EMAs. If a proper breakout happens at $8.69 we can see a target of $10

( click to enlarge )

Endocyte, Inc. (NASDAQ:ECYT) is showing signs of buying activity at current levels. Considering that is trading below cash on hand ($2.84/share) I started a long position here. Resistance level is the high of Friday, which is $1.39. Watch the stock closely next week for a possible move. A break above this level could result in an acceleration to the upside, targeting $1.7 area initially.

( click to enlarge )

I have Acacia Research Corp (NASDAQ:ACTG) on my watchlist for next week due to the recent price action, volume and momentum. Potential swing long above 3.90

( click to enlarge )

Juno Therapeutics Inc (NASDAQ:JUNO) is developing a bull flag formation and the breakout should be a nice one if it can hold up.

If you want to contact me for advertising opportunities on blog or twitter, then get in touch via email

Disclaimer : This is not an investment advisory, and should not be used to make investment decisions. Information in AC Investor Blog is often opinionated and should be considered for information purposes only. No stock exchange anywhere has approved or disapproved of the information contained herein. There is no express or implied solicitation to buy or sell securities. The charts provided here are not meant for investment purposes and only serve as technical examples. Don't consider buying or selling any stock without conducting your own due diligence.

Thanks for visiting AC Investor Blog.

AC

Labels: , , , , ,

Bookmark and Share

Wednesday, June 28, 2017 

My Watchlist for Thursday, June 29

( click to enlarge )

FireEye Inc (NASDAQ:FEYE) jumped 33 cents today and closed at 10.74 slightly below key resistance and the top line of the ascending triangle formation in which stock consolidated since May. If a breakout above the 16.25 occurs, we could see an acceleration of momentum and move toward the 17.50-18.42 area. Daily technical indicators are becoming more favorable with MACD and RSI starting to turn up.

( click to enlarge )

Catabasis Pharmaceuticals Inc (NASDAQ:CATB) finally closed above the 50 day exponential moving average (EMA) today and can potentially set-up very well for a swing-trade if the stock breaks through the key resistance level at $1.47. This could be the start of a rally to $2+

( click to enlarge )

Spherix Inc (NASDAQ:SPEX) had a big day on Wednesday, jumping 79 cents, or 70%, on 14 million shares. That was the biggest volume in about 12 months. If it gets through the high, which is at about $2.23, this stock could explode into the stratosphere again.

( click to enlarge )

Sounds like Rentech, Inc. (NASDAQ:RTK) is gaining some momentum again. The stock has made a strong bounce off of the lows that were posted last week with high volume. If a proper breakout happens at $.48 we can see a target of $.71

( click to enlarge )

Retractable Technologies, Inc. (NYSEMKT:RVP) broke the horizontal resistance line today on strong volume and could eventually rally up to test its 200-day EMA at 1.45. Congrats to those who got in early today after my alert on twitter at 1.20.

If you want to contact me for advertising opportunities on blog or twitter, then get in touch via email

Disclaimer : This is not an investment advisory, and should not be used to make investment decisions. Information in AC Investor Blog is often opinionated and should be considered for information purposes only. No stock exchange anywhere has approved or disapproved of the information contained herein. There is no express or implied solicitation to buy or sell securities. The charts provided here are not meant for investment purposes and only serve as technical examples. Don't consider buying or selling any stock without conducting your own due diligence.

Thanks for visiting AC Investor Blog.

AC

Labels: , , , ,

Bookmark and Share

Thursday, June 22, 2017 

My Watchlist for Friday, June 23

( click to enlarge )

Prana Biotechnology Limited (NASDAQ:PRAN) Still on my top list. The stock is forming a cup and handle bottom pattern, which is a bullish formation. If price breaks the neckline at 2.49 we can see a fast move up to the next resistance levels of 3.05 and 3.2. Technicals are looking bullish.

( click to enlarge )

FORM Holdings Corp. (NASDAQ:FH) broke out of a small consolidation pattern on higher volume today. This will lead to a price target of 1.95-2.09. Key indicators on daily charts suggest continuation of positive bias and the stock price is likely to show further up side. On watch.

( click to enlarge )

FireEye Inc (NASDAQ:FEYE) has been in a nice bullish consolidation over the last two months and appears ready for another breakout. Keep on watch.

( click to enlarge )

Valeant Pharmaceuticals Intl Inc (NYSE:VRX) broke out in a big way on great volume. This stock continues to show strength as the rise in volume confirms the price uptick. Next resistance lies around the 17.50 area.

( click to enlarge )

Ampliphi Biosciences Corp (NYSEMKT:APHB) is possible trend reversal trade if it breaks 96c resistance area. The daily technical indicators are displaying good signs. Watching for a breakout soon.

( click to enlarge )

Trillium Therapeutics Inc. (NASDAQ:TRIL) is forming a potential double bottom formation. Daily chart depicts a resistance near 4.9 level. A break above this key level will confirm a new bullish trend and the following uptrend will take price up to $6 zone.

If you want to contact me for advertising opportunities on blog or twitter, then get in touch via email

Disclaimer : This is not an investment advisory, and should not be used to make investment decisions. Information in AC Investor Blog is often opinionated and should be considered for information purposes only. No stock exchange anywhere has approved or disapproved of the information contained herein. There is no express or implied solicitation to buy or sell securities. The charts provided here are not meant for investment purposes and only serve as technical examples. Don't consider buying or selling any stock without conducting your own due diligence.

Thanks for visiting AC Investor Blog.

AC

Labels: , , , , ,

Bookmark and Share

Saturday, April 22, 2017 

My Watchlist for Monday, April 24

( click to enlarge )

Clean Diesel Technologies, Inc. (NASDAQ:CDTI) broke out Friday on a higher then average volume after two months of consolidation. The stock is likely to continue with momentum toward the next resistance at the 3.55 level and then 4.30. Technical indicators signal a positive momentum for the stock. If history repeats itself, we could see another strong rally next week.

( click to enlarge )

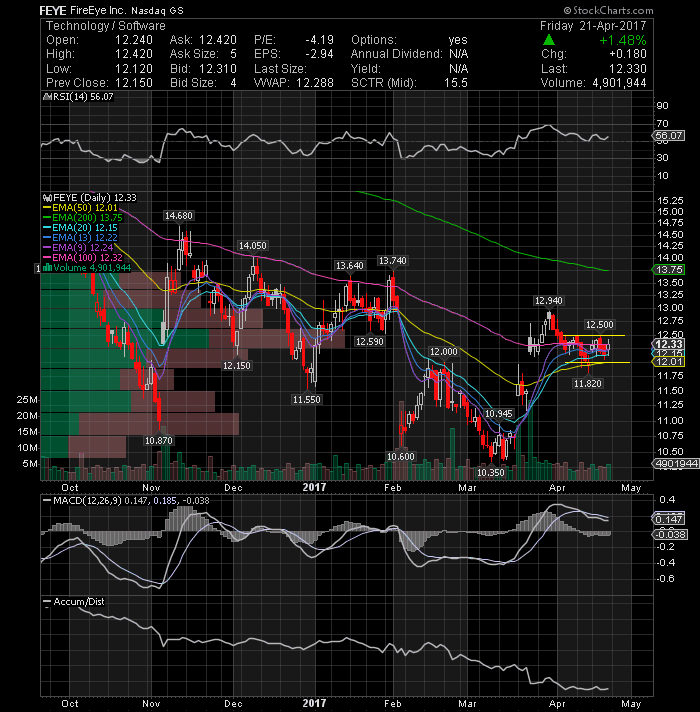
FireEye Inc (NASDAQ:FEYE) watch for a potential breakout of resistance and successful re-test to confirm further bullish view. If breakout occurs the next target level is in 13 area.

( click to enlarge )

Twitter Inc (NYSE:TWTR) chart also suggests possible reversal above horizontal resist level at 14.78

( click to enlarge )

pSivida Corp. (NASDAQ:PSDV) watch for a possible breakout out of the current downtrend line. I got the feeling that a very strong breakout is imminent. Momentum is picking up with MACD climbing and RSI rising. Look for a quick run to $2.10

( click to enlarge )

Akari Therapeutics PLC (NASDAQ:AKTX) rebounded strongly last week on pretty solid volume and might be on the way up again. Only a close below $16 reverses the current short-term uptrend.

( click to enlarge )

Torchlight Energy Resources Inc (NASDAQ:TRCH) broke out from its sideways consolidation on Friday with a 18% rally and a close over resistance at $1.879. Keep this one on your radar over the next week.

If you want to contact me for advertising opportunities on blog or twitter, then get in touch via email

Disclaimer : This is not an investment advisory, and should not be used to make investment decisions. Information in AC Investor Blog is often opinionated and should be considered for information purposes only. No stock exchange anywhere has approved or disapproved of the information contained herein. There is no express or implied solicitation to buy or sell securities. The charts provided here are not meant for investment purposes and only serve as technical examples. Don't consider buying or selling any stock without conducting your own due diligence.

Thanks for visiting AC Investor Blog.

AC

Labels: , , , , ,

Bookmark and Share

Monday, March 20, 2017 

My Watchlist for Tuesday, March 21

( click to enlarge )

Viavi Solutions Inc (NASDAQ:VIAV) has a good looking chart. The stock made a new 52-week high today, but was not able to close near this high. I’m a buyer of VIAV once it breaks Monday’s high for the follow through move. Long-term investors may hold with a stop at 9.64 (rising EMA50).

( click to enlarge )

Superconductor Technologies, Inc. (NASDAQ:SCON) Nice move today on heavy volume. Traders should watch for a potential breakout over 1.35. If price clears this key resistance, the next move may be powerful and should be enough to trigger a rally towards the $1.8 level. The outlook for stock remains positive supported by the major short-term EMAs and momentum indicators. Keep the stock on your radar.

( click to enlarge )

Shares of Moleculin Biotech Inc (NASDAQ:MBRX) have room for a significant uptick beyond these levels. A move above $1.18 (EMA20) could trigger a sharp move higher. Long set-up on watch.

( click to enlarge )

FireEye Inc (NASDAQ:FEYE) stock was upgraded this morning to BUY at BofA in an analyst note. A break through the top of this trading range could lead initially to 13.70. Further, we have seen strong call activity in this name over the past few weeks. On watch.

( click to enlarge )

Eagle Bulk Shipping Inc (NASDAQ:EGLE) are starting to heat up and are worth watching. If volume can pick up, I believe this stock can break through next resistance at $6 and re-test its February highs around $6.7.

( click to enlarge )

Hornbeck Offshore Services, Inc. (NYSE:HOS) stock bounced strongly again from its long-term $3-3.05 support. The bounce should continue tomorrow. Next major resistance lies at 4.25

If you want to contact me for advertising opportunities on blog or twitter, then get in touch via email

Disclaimer : This is not an investment advisory, and should not be used to make investment decisions. Information in AC Investor Blog is often opinionated and should be considered for information purposes only. No stock exchange anywhere has approved or disapproved of the information contained herein. There is no express or implied solicitation to buy or sell securities. The charts provided here are not meant for investment purposes and only serve as technical examples. Don't consider buying or selling any stock without conducting your own due diligence.

Thanks for visiting AC Investor Blog.

AC

Labels: , , , , ,

Bookmark and Share

Tuesday, January 31, 2017 

My Watchlist for Wednesday, February 01

( click to enlarge )

Juno Therapeutics Inc (NASDAQ:JUNO) broke through that critical 20.8 level today on solid volume. There is a high probability for a trend continuation in the next sessions, as the stock could test the next key resistance level in the 23 area.

( click to enlarge )

FireEye Inc (NASDAQ:FEYE) broke and closed above its declining EMA100 accompanied by high volume, so keep an eye on it to see if tomorrow will confirm the breakout. Indicators are looking bullish.

( click to enlarge )

OvaScience Inc (NASDAQ:OVAS) made a nice upside reversal in a weak market today after Blackrock has reported a stake of more than 5 percent in the company. Let’s see whether the stock can gather enough momentum to break through $1.60 (today's high). Clear break above this key area could trigger further bullish recovery testing 1.81. Immediate support at 1.54 followed by 1.51. I still holding a strong position at current levels.

( click to enlarge )

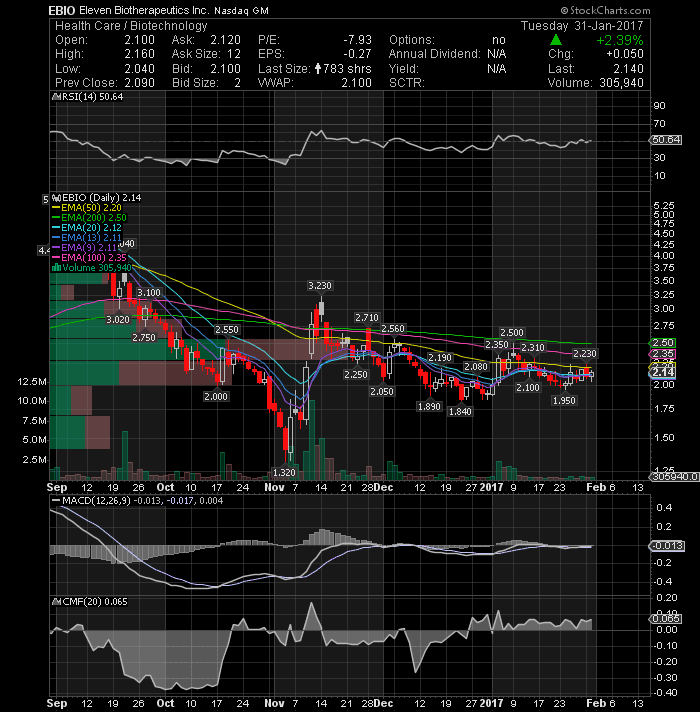
Eleven Biotherapeutics Inc (NASDAQ:EBIO) Coiling up here. Long and will add on break of its EMA50. CMF indicator remains positive, which is a good sign.

( click to enlarge )

The share price of Superconductor Technologies, Inc. (NASDAQ:SCON) is showing signs of a potential reversal. Clear break above 1.19 (EMA20) could trigger further bullish recovery testing 1.43 (EMA50).

( click to enlarge )

Twitter Inc (NYSE:TWTR) jumped 68c or 4%, Tuesday to close at 17.62, just slightly below its key resistance at 17.78. A break above this level could result in an acceleration to the upside. Short-term Momentum indicators also point to continuation of positive bias. Keep on watch.

( click to enlarge )

Allied Healthcare Products Inc (NASDAQ:AHPI) on my swing long list. The stock showed buying strength today. The 2.3-2.4 area is a critical resistance region that can determine overall bias for the stock in short-term.

( click to enlarge )

Conatus Pharmaceuticals Inc (NASDAQ:CNAT) had a great move on the upside today and closed above the 200EMA on hourly chart. The chart above suggests that stock might find now resistance at $4.37. Only a break above this level would suggest further upside, targeting the 4.70 area.

If you want to contact me for advertising opportunities on blog or twitter, then get in touch via email

Disclaimer : This is not an investment advisory, and should not be used to make investment decisions. Information in AC Investor Blog is often opinionated and should be considered for information purposes only. No stock exchange anywhere has approved or disapproved of the information contained herein. There is no express or implied solicitation to buy or sell securities. The charts provided here are not meant for investment purposes and only serve as technical examples. Don't consider buying or selling any stock without conducting your own due diligence.

Thanks for visiting AC Investor Blog.

AC

Labels: , , , , , , ,

Bookmark and Share
Contact

About Me

    Photobucket
  • I'm a 48 year old Independent Trader using proprietary technical analysis with more than 20 years experience of investing in the US stock markets. I started this blog in 2006 simply as a way to share my thoughts about capital, risk management, and trading. My blog contains only my personal opinion and is provided for informational purposes only.

  • Benzinga.com supporter

    Benzinga.com supporter


    FREE NEWSLETTER

      Enter your email address:

      Delivered by FeedBurner

      Subscribe my feed :

    Support AC

    • Support AC Investor Blog, Donate with PayPal

    Advertising

      Interested in advertising on AC Investor Blog ? Click Here

    TRANSLATOR

    Site Information

    Stock Market Blogroll

    Friends BLOGROLL

    ARCHIVES

Powered by Blogger
and Blogger Templates


Add to Google