-Financial Tools Futures Market--TRADE IDEAS-- OPTION ALERTS -BENZINGA PRO-

Saturday, March 05, 2022 

Swing trade setups for next week 7-11 Mar 2022


( click to enlarge )

Imperial Petroleum Inc (NASDAQ:IMPP) is setting up to take this resistance over 3.45 out

( click to enlarge )

Camber Energy Inc (NYSEAMERICAN:CEI) Nice big bullish engulfing candle on heavy volume Friday closing back above the 50-day EMA. Looking good to go higher.

( click to enlarge )

Appharvest Inc (NASDAQ:APPH) cleared resistance on expanding volume and looks ready to extend its gains. Keep on watch list.

( click to enlarge )

Agilon Health Inc (NYSE:AGL) had another impressive trading session. I feel the stock looks poised to breakout in the coming sessions as attention appears to be returning to the stock via price gains and volume.

( click to enlarge )

Nice breakout on Gold Resource Corporation (NYSEAMERICAN:GORO) on 2x the daily average volume, positive MACD. Look for a quick run to $2.14 then on to $2.3

( click to enlarge )

Context Therapeutics Inc (NASDAQ:CNTX) closed up 2.69% on Friday. I would keep an eye on this stock. It has been slowly creeping higher and I think it could be trading over $2.2 in the short-term. On the technical side, we have a rising MACD on the negative territory, while RSI is moving upwards. We could see here a BCEL type-move, the stock is also trading under cash levels.

( click to enlarge )

TransGlobe Energy Corporation (NASDAQ:TGA) is getting ready to come out of a bullish consolidation pattern in the next few days. A close above $4.08 gets the party started.

( click to enlarge )

Oasis Petroleum Inc. (NASDAQ:OAS) Setting up nicely for new highs. Breakout watch over 146.73

( click to enlarge )

Jaguar Health Inc (NASDAQ:JAGX) is showing extremely oversold conditions. Looks ready for a short-term bounce. I have been buying for a swing trade.

Disclaimer : This is not an investment advisory, and should not be used to make investment decisions. Information in AC Investor Blog is often opinionated and should be considered for information purposes only. No stock exchange anywhere has approved or disapproved of the information contained herein. There is no express or implied solicitation to buy or sell securities. The charts provided here are not meant for investment purposes and only serve as technical examples. Don't consider buying or selling any stock without conducting your own due diligence.

Thanks for visiting AC Investor Blog.

AC

Labels: , , , , , , , ,

Bookmark and Share

Saturday, October 02, 2021 

Trading setups for next week


( click to enlarge )

Camber Energy Inc (NYSEAMERICAN:CEI) stock has been pulling back quite a bit in the past few days but nothing is wrong with it, the uptrend remains intact and pullbacks are always healthy for a trend continuation. Seems to be forming an uptrend channel on hourly chart  with a major support at 2.50 with a minor support at 2.86. Plus, it has been under accumulation in a quiet manner. So, play what you see.

( click to enlarge )

Indaptus Therapeutics, Inc. (INDP) is setting up for a possible breakout, which based on the chart could send the stock up like a rocket. The RSI14 at 40 and the MACD is still curling upward. Chart on Breakout Watch.

( click to enlarge )

LM Funding America, Inc. (LMFA) had good volume and a big bullish candlestick on Friday. Breakout watch over 4.98

( click to enlarge )

CASI Pharmaceuticals, Inc. (CASI) is still in bottoming mode. The technical indicators are looking better now for the stock. The MACD is starting to rise, confirming a bullish divergence has taken form and the Stochastic also has a bullish crossover. It might attempt to breakout above the $1.25 level on Monday and if it succeeds we should expect a strong move to the upside. It has the potential to make another big run next week, so keep a close eye on CASI and don’t miss the trade. The price target of the two Wall Street analysts that rated the stock since the last quarterly report is $3.9

( click to enlarge )

I want to congratulate anyone that saw the opportunity in Silverback Therapeutics, Inc. (SBTX) at $10. Keep watch because the technicals are indicating there could be more juice left in this small bio cap, offering up multiple intraday entry points. Real fireworks begin over 12

( click to enlarge )

Sphere 3D Corp. (ANY) We have all seen how quickly this stock can head higher, when the buyers come. Watch this BOX and play accordingly. I believe it is ready to post a nice bounce and I do not see any resistance on the technical chart until $7.6. From a technical standpoint, the Relative Strength Index is now rising and is approaching the mid-level, while MACD is about to cross up.

( click to enlarge )

Chemomab Therapeutics Ltd (NASDAQ:CMMB) My opinion remains intact about this small bio cap. I will not sell a single share below $40 unless something bad happens, but that does not seem to be the case according to the recent news and reports. The stock has been falling on very low volume. The company has a great pipeline and the existing cash position is expected to fund the Company's current operating plan until mid 2023. The stock market is a device for transferring money from the impatient to the patient" Warren Buffet. I remember being called a pumper on PLUG or MARA when the stocks were trading at $2. NOTE: The 2 Wall Street analysts offering 12-month price forecasts for Chemomab Therapeutics Ltd have a median target of 43.50, with a high estimate of 45.00 and a low estimate of 42.00

( click to enlarge )

AMC Entertainment Holdings Inc (NYSE:AMC) Rallied nicely Thursday on volume and broke out of a descending channel. If it clears back over 42, it may have some good upside.

( click to enlarge )

Pedevco Corp (NYSEAMERICAN:PED) broke out of a consolidation range to the upside on heavy volume. I do not see anything until the 2.8-3 area. Indicators are also showing signs of recovery. Pullbacks are buyable.

( click to enlarge )

ENGlobal Corp (NASDAQ:ENG) is very bullish with a lot of hot indicators showing up. The slope of the upward move is steep accompanied by increasing volume. Breakout watch over 3.37

TRADE IDEAS TEST DRIVE IS BACK: The next 2-week Test Drive starts October 11, and runs until October 22nd. The Test Drive lets non-subscribers or standard subscribers enjoy all Premium Subscription features for up to 2-weeks. I recommend you sign up HERE before Monday, October 11 so you will have the full 2-weeks of access.

Disclaimer : This is not an investment advisory, and should not be used to make investment decisions. Information in AC Investor Blog is often opinionated and should be considered for information purposes only. No stock exchange anywhere has approved or disapproved of the information contained herein. There is no express or implied solicitation to buy or sell securities. The charts provided here are not meant for investment purposes and only serve as technical examples. Don't consider buying or selling any stock without conducting your own due diligence.

Thanks for visiting AC Investor Blog.

AC

Labels: , , , , , , , , ,

Bookmark and Share

Sunday, September 26, 2021 

A Few names on TOP of my watchlist for the coming week


( click to enlarge )

Camber Energy Inc (NYSEAMERICAN:CEI) broke through resistance and out of a small bullish flag formation last week. The technical daily chart above shows very strong upward momentum as the stock is above all the major moving averages with both 50-day EMA and 200-day exp moving averages going up. All indicators still point to a bull market. The next level to watch is Friday's high of 2.29, followed by 2.80. Support awaits at 1.81, a low point on Friday, followed by 1.70, which provided support on Thursday (EMA50). With the trend still up the bias is to the upside.

( click to enlarge )

The stock has been in a tremendous tailspin the last two weeks. TMC the metals company Inc (NASDAQ:TMC) has seen a bevy of selling bring the stock to fresh new lows for the year and created the opportunity of a potential big short squeeze in the coming days due to its high rate of short interest relative to its float. It was over $15 on Sept 13th and closed on Friday at $5.11. We could see a sharp rally out of these extreme oversold conditions. 

( click to enlarge )

I think Novan Inc (NASDAQ:NOVN) will post a sharp rally from current levels. This was a $20 stock in June and at $8.14, in my opinion, there is a compelling risk/reward scenario. The risk is the stock continues to fall, the reward is a swift 30-50% type move for this oversold stock. Analysts price targets are very high compared to current prices.

( click to enlarge )

Comstock Mining Inc (NYSEAMERICAN:LODE) remains one to watch. I think this stock will explode if positive news hits the wires. Investors are waiting for some kind of partnership with Tesla in Nevada (LiNiCo is located next to the Tesla gigafactory). From a technical standpoint, it is showing signs of bottoming out on the charts along with the MACD giving positive signals.

( click to enlarge )

Minerva Neurosciences Inc (NASDAQ:NERV) broke out and never stopped on Friday. There is a good chance the stock will continue to move up. We saw some unusual call options activity today Oct $2.5

( click to enlarge )

Tesla, Inc. (NASDAQ:TSLA) closed strong above the $770 area for the first time since April. This momentum could push this stock much higher from here. Next resistance is now seen at $780.79

( click to enlarge )

On the radar. Naked Brand Group Ltd (NASDAQ:NAKD) gave us a nice move last week, which could be the start of a bigger move. If the stock can break through the 77c price level, we should see a strong follow through move. Keep watching the stock.

( click to enlarge )

Resonant Inc (NASDAQ:RESN) is a potential breakout play. Momentum picking up with MACD climbing and RSI rising. Breakout watch over $2.94

( click to enlarge )

Blackberry (NYSE:BB) The stock pulled back on Friday after they reported recent results last week and provides an opportunity to invest at a better valuation. It should resume the upside move next week for a possible run to test the recent highs at 12

Disclaimer : This is not an investment advisory, and should not be used to make investment decisions. Information in AC Investor Blog is often opinionated and should be considered for information purposes only. No stock exchange anywhere has approved or disapproved of the information contained herein. There is no express or implied solicitation to buy or sell securities. The charts provided here are not meant for investment purposes and only serve as technical examples. Don't consider buying or selling any stock without conducting your own due diligence.

Thanks for visiting AC Investor Blog.

AC

Labels: , , , , , , , ,

Bookmark and Share

Sunday, September 19, 2021 

Chart setups to keep an eye on next week


( click to enlarge )

Pharmacyte Biotech Inc (NASDAQ:PMCB) has been in the process of forming a bottom pattern for the past couple of weeks. A move past $3.93 would be a strong indicator of a further rebound in the stock. Once it breaks through resistance, we should see strong volume as the stock will breakout and move higher. The money seems to be flowing into the stock as indicated by the On Balance Volume line. Keep watching the stock. I took a big position last week.

( click to enlarge )

Ironnet Inc (NYSE:IRNT) stock has pulled back to $30 from $47 after a profit-taking run, providing a suitable entry point for active traders. Short-term MACD is crossing up while OBV remains at high levels. Might bounce here.

( click to enlarge )

Silverback Therapeutics Inc (NASDAQ:SBTX) has been in a tremendous tailspin the last two months. I think this stock will post a sharp rally from current levels. This was a $31 stock in August and at $12.55, in my honest opinion, there is a compelling risk/reward scenario. Plus, the OBV indicator is displaying a bullish divergence, showing high buying volumes. I bought some shares on Friday afternoon. The risk is the stock continues to fall, the reward is a swift 20-35% type move for this highly oversold stock. I've been spot on with these bottom plays recently.

( click to enlarge )

Camber Energy Inc (NYSEAMERICAN:CEI) has been in a strong upwards trend the past few weeks and it seems to be working out the overbought conditions. As you can see on the chart above, the rising EMA9 line on the 4H has been providing a significant support for the stock on the rise, so only a close below that line would indicate that a pullback is on its way. In that scenario, there are a lot of supports below. On the other hand, if a breakout above 1.87 occurs, we could see an acceleration of momentum and move toward the 2-2.26 area.

( click to enlarge )

Wisekey International Holding AG (NASDAQ:WKEY) is a NFT play to keep an eye on. I am still watching WKEY shares due to the recent price action, volume, news and momentum. Overall, the stock is showing some positive technical signs of reversing its long-term downtrend. If it breaks 9.37 next week, the first target on a swing would be the $12 area.

( click to enlarge )

Wish (NASDAQ:WISH) is a stock that could head higher from Friday's close. It is in the process of bottoming and I expect a pop above $7.75 at some point in the coming weeks.

Disclaimer : This is not an investment advisory, and should not be used to make investment decisions. Information in AC Investor Blog is often opinionated and should be considered for information purposes only. No stock exchange anywhere has approved or disapproved of the information contained herein. There is no express or implied solicitation to buy or sell securities. The charts provided here are not meant for investment purposes and only serve as technical examples. Don't consider buying or selling any stock without conducting your own due diligence.

Thanks for visiting AC Investor Blog.

AC

Labels: , , , , ,

Bookmark and Share

Sunday, September 12, 2021 

Here are several penny stocks and others to watch next week


( click to enlarge )

You know, sometimes hitting a winner in the market can be so effortless, and when it happens, you gotta celebrate a little bit. Once again Camber Energy Inc (NYSEAMERICAN:CEI) amazed and wowed the market with another Monster rally on strong volume expansion. A little over a month ago the stock was dead to the world and I wrote on Stocktwits/Twitter on Aug 5th about the similarities that were appearing on the bottom pattern of the chart, that reminded me of past mega bounces, and Voilá, i nailed it. A few days later the stock did exactly the same explosive move and is now trading around $1.50. Congratulations to all my readers and twitter followers that played and pocketed some massive gains. In the very short-term, the stock is back to extreme overbought levels following the gains last week, so a pullback could be in order before the uptrend resumes. However, if stock spends a prolonged period in the extreme overbought levels, it shows the trend is upward and in this case a move to next pivot level of $2.26 is realistic.

( click to enlarge )

Antelope Enterprise Holdings Ltd (NASDAQ:AEHL) For those of you that will be celebrating this weekend thanks to the CEI massive rally, I would like to present this chart of another low float stock that could see a nice bounce in the week ahead. I am very good at sniffing out stocks that are on the cusp of a short squeeze. Unlike buying a stock, when you can only lose as much as you invest, a short seller's loss potential is literally unlimited, which is one of the reasons why short squeezes occur. It's a panic and it can cause rapid moves higher in a stock price and in low float stocks the move could be even quicker. With just 2M shares public float and nearly 25% of the float sold short with a bottom chart, this stock is literally one of the best cases for a good risk/reward to create a short squeeze. This was a $7 stock less than 4 months ago and once it starts to squeeze higher there is really no telling exactly where it will go. One thing I do know, shorts need to buy back the stock to profit from their bets, which only adds fuel to the fire. The break of 3.48 next week could be explosive.

( click to enlarge )

Acasti Pharma Inc (NASDAQ:ACST) is also bottoming out. This one could easily run to $3 in a heartbeat, just needs a little love and attention. Bullish MACD crossover on 4h chart.

( click to enlarge )

Ironnet Inc (NYSE:IRNT) is still looking very strong. It pulled back a little at the end of the day on a small sell, but otherwise was up ticking with every buy. I expect this momentum to carry right on through to next week, where we could see $28 - $30 in rapid fashion. Keep an eye on her.

( click to enlarge )

Naked Brand Group Ltd (NASDAQ:NAKD) penny stocks have been on fire and this MEME stock deserves your attention again. Not only because it is a penny stock, but also because the chart is curling up. The technical 4H chart shows the possibility of a new rally as the stock bounced up after dropping back to its previous major resistance area, now major support. Further rebound is expected to test 66c. If a break above this level occurs, price could eventually target the 80c region to the upside.

( click to enlarge )

Wisekey International Holding AG (NASDAQ:WKEY) I remain firmly behind this NFT stock. This stock is currently trading around $8 and I have little doubt it rallies to well beyond $20 at some point. Those accumulating at these levels, in my honest view, will be sitting on some sizable profits down the road. Patience is key.


( click to enlarge )

Professional Diversity Network, Inc. (NASDAQ:IPDN) This stock is in the process of bottoming and we expect a pop above its 200-day EMA at some point in the coming sessions.

( click to enlarge )

On the watchlist no trigger yet. Long above $2.14. If the stock can break through this level, buy the stock and watch it take off. There is plenty of accumulation on the daily chart.

( click to enlarge )

Ion Geophysical Corp (NYSE:IO) Large volume on Friday. This is a candidate for a breakout, $1.50 is the pivot level to watch.

Disclaimer : This is not an investment advisory, and should not be used to make investment decisions. Information in AC Investor Blog is often opinionated and should be considered for information purposes only. No stock exchange anywhere has approved or disapproved of the information contained herein. There is no express or implied solicitation to buy or sell securities. The charts provided here are not meant for investment purposes and only serve as technical examples. Don't consider buying or selling any stock without conducting your own due diligence.

Thanks for visiting AC Investor Blog.

AC

Labels: , , , , , , , ,

Bookmark and Share

Monday, September 06, 2021 

Good looking chart setups to watch this week

( click to enlarge )

Camber Energy Inc (NYSEAMERICAN:CEI) This daily chart represents a stock under tremendous accumulation. From a technical standpoint, the stock is overbought but I see the momentum and price gains continuing through next week. If the stock continues to see buying pressure I could see it trading well over $1 in the short term. Penny stock on watch.

( click to enlarge )

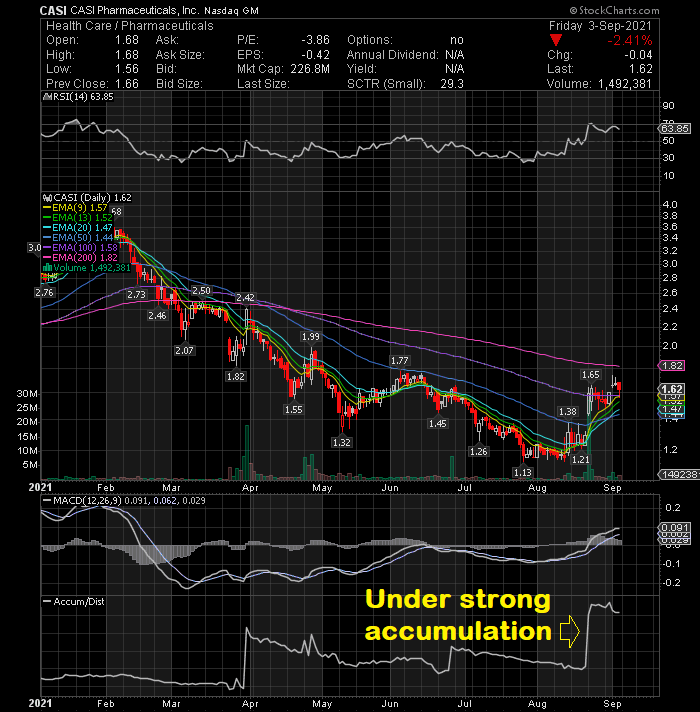
CASI Pharmaceuticals Inc (NASDAQ:CASI) The daily chart is shaping up and I expect the next point of resistance to be at $2.25. At some point CASI will take off and never look back. I think that day will come soon and those buying at these prices will be thanking me down the road. Oppenheimer analyst Leland Gershell recently raised the price target on CASI to $6.00 (from $5.00) while maintaining Outperform rating and the CEO purchased 480000 shares in August owning more than 5 million shares. I think CASI is heading higher from here and will make an excellent trade going forward.

( click to enlarge )

Exela Technologies Inc (NASDAQ:XELA) Volume has lightened up and the price is holding up nicely above the major short-term rising EMAs. This looks like the spot where the bulls will begin to make their move. From a technical standpoint, the stock may be ready to break out of this potential bullish flag consolidation while MACD is also starting to move higher. Only a close above 2.75 would suggest further upside. XELA will move quickly, so keep it on your screen.

( click to enlarge )

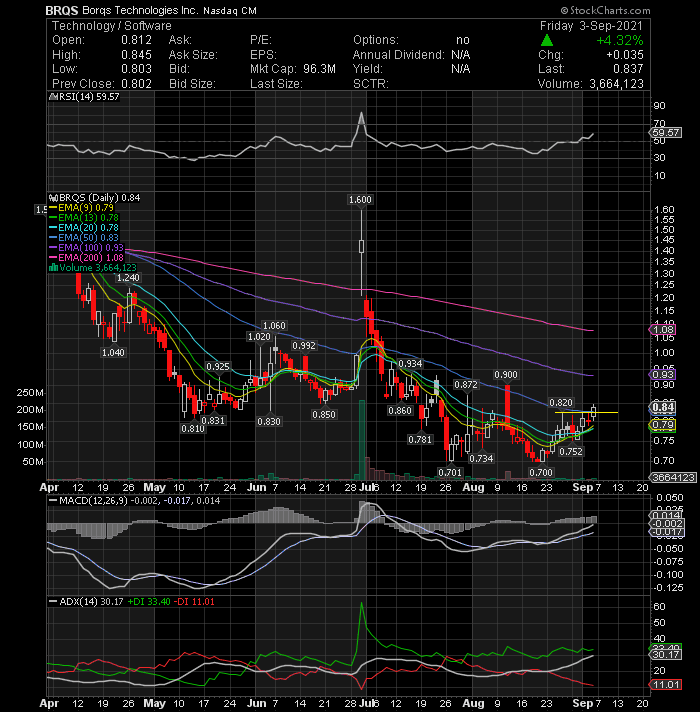
Borqs Technologies Inc (NASDAQ:BRQS) volume and price are on the rise and this stock is really getting some momentum behind it. The share price has finally crossed and closed above the declining 50-day EMA, which is very positive. All major short-term EMAs have started moving up, with the 9-day EMA above the 20-day EMA for the first time in more than 2 months. Friday’s intraday high of 0.845 was also the highest level the stock has touched in more than two weeks. The daily technical indicators are pointing to a continuation of the rally.

( click to enlarge )

Enveric Biosciences Inc (NASDAQ:ENVB) The buying was coming quickly on Friday for this stock. I am interested to see if it keeps going this week. It is on watch.

( click to enlarge )

Medavail Holdings Inc (NASDAQ:MDVL) I accumulated a lot of shares around $3 and the stock is paying off handsomely now. As I mentioned several times, the gap zone is my target. Let the profits run.

( click to enlarge )

Globalstar (NYSEAMERICAN:GSAT) The $2.42 area is a critical resistance region that can determine overall bias for the stock in the short-term. Bulls are now attacking the 2.25 price level, a break above could trigger a rally towards 2.42 resistance again. Keep an eye on these levels. Love the look of this hourly chart.

( click to enlarge )

Nio Inc (NYSE:NIO) is on the verge of a possible technical breakout. The stock closed slightly below the 50-day EMA on the daily chart. A breakout above this key EMA is a signal that there is a potential long-term trend change taking place. The strongest sign of a bullish momentum is the daily MACD indicator which has just started to increase. The RSI is also showing positive signs on the stock. On watch.

( click to enlarge )

Clover Health Investments Corp (NASDAQ:CLOV) The more it consolidates the bigger and strong run/squeeze it will have. On the technical side, MACD and ADX all point to an upward trend while RSI is also rising. Watch the stock closely on Tuesday, and once it breaks through $9, get ready to enter the trade.

Disclaimer : This is not an investment advisory, and should not be used to make investment decisions. Information in AC Investor Blog is often opinionated and should be considered for information purposes only. No stock exchange anywhere has approved or disapproved of the information contained herein. There is no express or implied solicitation to buy or sell securities. The charts provided here are not meant for investment purposes and only serve as technical examples. Don't consider buying or selling any stock without conducting your own due diligence.

Thanks for visiting AC Investor Blog.

AC

Labels: , , , , , , , ,

Bookmark and Share
Contact

About Me

    Photobucket
  • I'm a 48 year old Independent Trader using proprietary technical analysis with more than 20 years experience of investing in the US stock markets. I started this blog in 2006 simply as a way to share my thoughts about capital, risk management, and trading. My blog contains only my personal opinion and is provided for informational purposes only.

  • Benzinga.com supporter

    Benzinga.com supporter


    FREE NEWSLETTER

      Enter your email address:

      Delivered by FeedBurner

      Subscribe my feed :

    Support AC

    • Support AC Investor Blog, Donate with PayPal

    Advertising

      Interested in advertising on AC Investor Blog ? Click Here

    TRANSLATOR

    Site Information

    Stock Market Blogroll

    Friends BLOGROLL

    ARCHIVES

Powered by Blogger
and Blogger Templates


Add to Google