-Financial Tools Futures Market--TRADE IDEAS-- OPTION ALERTS -BENZINGA PRO-

Saturday, October 17, 2020 

Big, Mid and Small caps to watch next week

( click to enlarge )

Thermogenesis Holdings Inc (NASDAQ:THMO) Get ready for take-off. This company has built up a strong COVID news profile and this has bled into its technical setup. The biggest catalyst though is THMO’s trading price. At less than $3 it is being touted as the discounted play of the month so far. The strong mix of pattern and positive divergences on key momentum indicators has given the stock very strong upside potential. I suspect it won't be off the list of many potential buyers. The bounce potential in the play is huge, relative strength is pretty much neutral and liquidity is quite strong. Most importantly, it has been forming a large falling wedge pattern, in play for almost 3 months confirmed by the bounce at the bottom a few days ago, but now it seems like THMO managed to close outside of it and will start a new market cycle possibly. A look at the oscillators still indicates an overall bullish setup with stochastic and RSI both indicating strengths. Trading volumes have been strong since the past few trading sessions, which is also a clear indication of higher participation in the stock. This could break north so be ready.

( click to enlarge )

After a long stint stuck under $2 per share, ADiTx Therapeutics Inc (NASDAQ:ADTX) finally broke out to the upside with some authority. I believe there are still plenty of profits on the table for the stock and that’s why I'm bringing it to your attention once again. It closed up over 12% on 4M shares traded, one of the highest-volume days of the year. Long positions can be considered with a stop loss of 1.84 on a daily closing basis. Initial targets are 2.84 and 3 From a technical perspective the MACD is rising in negative territory and RSI is again moving upward.

( click to enlarge )

Boeing (NYSE:BA) The declining 100-day exponential moving average has been a strong wall over the past months, but it's likely to be broken soon. BA needs to take out $173.4 with vengeance. The break of the resistance line with heavy volume should be the next buy point. The stock is setting up for a strong move soon. Check out the volume on the daily chart as it approaches the top. One to watch next week for sure.

( click to enlarge )

Catalyst Biosciences Inc (NASDAQ:CBIO) has been on a remarkable run in the last trading sessions. The long-term trend is turning positive as the stock is back above the 200-day exponential moving average. However, since RSI is approaching an overbought level there may be a chance of short correction and for now $6.50 level will be hard to break.

( click to enlarge )

Hertz Global Holdings Inc (NYSE:HTZ) Trading range for the next trading session is seen between 2.30-2.75 and either side break out will give clear direction to the prices. HTZ will move quickly, so keep it on your screen on Monday.

( click to enlarge )

XpresSpa Group Inc (NASDAQ:XSPA) stock is backtesting both its short-term EMAs and recently broken uptrend line. If the stock can decisively break 2.25, it could run to 2.55-2.63 before a possible test of the recent highs. Bulls will note that the stock is still quite oversold, but the stock will need to break and hold its 50-day EMA in order to set the stage for a move higher.

( click to enlarge )

Beasley Broadcast Group Inc (NASDAQ:BBGI) Despite the slow market action on Friday, BBGI's stock performed well relative to the whole market. From a technical standpoint, it looks like a bottom formation here. A breakout over $1.41 with strong volume would send this flying. Long setup on watch.

( click to enlarge )

Gogo Inflight Internet (NASDAQ:GOGO) is coming up to a big level, as the stock is near its recent highs around 11.25. I'll be watching this stock closely next week as I expect to see a strong move once the stock breaks through resistance. A move past $11.25 would be a strong indicator of a further uptrend in the stock. The technical daily chart shows a continuation of the uptrend with MACD and RSI in the Bullish areas. On watch.

( click to enlarge )

Lazydays Holdings Inc (NASDAQ:LAZY) stock hit a new high and continues to draw interest. I would keep a close eye on this stock going forward it may make for a great trade. As long as the stock stays above $16.26, the bullish scenario is still intact. From a technical perspective, the chart shows very strong bullish signs. The stock is trading above all major EMAs with both moving average pointing upwards. Additionally, the accumulation/distribution line still shows the stock is on the positive swing. Friday’s high was $17.69, which is resistance for the follow through move. If the stock can break through this level, expect to see heavy volume drive the stock higher. Long setup.

( click to enlarge )

ProPhase Labs Inc (NASDAQ:PRPH) broke out and never stopped all day. There is a good chance the stock will continue to move up. Could squeeze over 7.49

During the day I tweet many times to my readers. I encourage everybody to subscribe AC Investor Blog twitter and newsletter, so you can receive my trade ideas and stock news in real time.

Disclaimer : This is not an investment advisory, and should not be used to make investment decisions. Information in AC Investor Blog is often opinionated and should be considered for information purposes only. No stock exchange anywhere has approved or disapproved of the information contained herein. There is no express or implied solicitation to buy or sell securities. The charts provided here are not meant for investment purposes and only serve as technical examples. Don't consider buying or selling any stock without conducting your own due diligence.

Thanks for visiting AC Investor Blog.

AC

Labels: , , , , , , , ,

Bookmark and Share

Saturday, May 09, 2020 

Top Twelve trading ideas for the coming week - A BIG THANK YOU to all of you 85000 followers on Stocktwits

Dearest Readers, 

I would like to thank you for your cooperation and support during the last few weeks, with a high increase of followers on the blog and a great increase in the number of followers on twitter that has almost reached 50,000 followers. As some of you may have noticed, last week I hit 85,000 followers on Stocktwits which was a huge achievement for me. A BIG THANK YOU to all of you.

( click to enlarge )

The hourly chart of  Creative Realities Inc (NASDAQ:CREX) broke out of a bull flag pattern to the upside Friday on solid volume, which is very bullish. Technical indicators are still looking bullish. Hourly MACD is positive and rising above its signal line. RSI has moved above its 50% level after a healthy correction. Watch for a good follow through day on Monday. Any breakout above the 2.94 level on closing basis may take the stock close to 3.5 and beyond that the 4 area. Stop 2.25

( click to enlarge )

On the daily chart, Boeing (NYSE:BA) has been forming a descending triangle, which in most cases results in a price breakdown. The nearest level of resistance lies at the upper boundary of the triangle now located at $143. If the bulls break up the triangle on solid volume, will invalidate the descending triangle pattern and indicates to the investors that the stock is ready to head higher. On the flip side, the major support lies at the lower boundary of the triangle located around the $120 area. Key momentum indicators are inside their respective oversold zones. Daily MACD is rising above its signal line in negative territory and the daily RSI is trading slightly below the 50 level. If we would like to see a positive breakout, we would need the daily RSI to rise above the 50 level and continue higher. Definitely on watch next week.

( click to enlarge )

CHEK remains on my top penny watchlist. I have been accumulating this stock over the past days like i did with MARK in March. Looking at the chart, the accumulation is impressive and this, in my view, bodes well for the stock. In addition, the direct offering reported on Friday 12% above the Friday's close, reinforced my conviction that institutions have been massively buying this stock at current levels. These are facts, not speculation. I play what i see, not what is written on the stars. From a technical standpoint, daily technical indicators have formed bullish rounding bottom patterns inside their respective oversold zones. Plus, the strong volumes and sharp volatility in the past few trading sessions indicate uncertainty by investors, which often precedes a trend change. Im looking for an initial run to 63c then $1 is a possibility. Im still long.

( click to enlarge )

If Verastem Inc (NASDAQ:VSTM) can break out above $2.04 with heavy volume, I think the stock could shoot up to test the $3 area. There looks to be good upside potential, so watch the stock very closely next week. Still on my top watchlist. 

( click to enlarge )

SAFE T GRP LTD/S ADR (NASDAQ:SFET) looks about ready to pop here! The stock is picking up momentum and could make a good upside very soon. The trend indicator daily MACD has triggered a fresh buy signal as it curved upward and crossed above its signal line. OBV continues to make higher highs and indicates that there is solid buying of the stock on positive days. The price needs to break Friday's high of $1.33 to expect a strong rally at this point. This stock has a history of big rallies, so I took a strong position on Friday for a possible new rally to +$2

( click to enlarge )

Co-Diagnostics Inc (NASDAQ:CODX) jumped 5% on Friday finishing the session near the highs of the day on high volume, suggesting buyers are stepping in. The move puts this stock in high probability of a breakout above key resistance in the $15.7 area. If the stock breaks and closes above the neckline of this inverted Head and Shoulders pattern there's a good opportunity to go long and follow the uptrend. Long setup on watch.

( click to enlarge )

Remark Holdings Inc (NASDAQ:MARK) With a run of over 400% since March lows (i started accumulating and alerted this stock in late March), it makes sense that we look at the current valuation of the stock for signs of a possible pullback, and Friday's candle is telling us something. The stock seems to have formed a possible Spinning Top candlestick chart pattern. This is a type of  formation that occurs when buyers and sellers balance each other out, resulting in similar opening and closing price levels. On the other hand, the daily RSI is also showing lower highs as shown by the trendline. This could be an additional confirmation, that the current trend might reverses here or at least pulls back a little bit before the uptrend continues. I know that Bulls will not agree with me, but it is what it is and a pullback could be perfectly normal. Note: Currently i don't own any shares, i sold all my position with more than 100% gains.

( click to enlarge )

I have been watching IMAC Holdings Inc (NASDAQ:IMAC) over the past few days, waiting for a possible upside move. The stock seems to have found a strong support at present levels. The daily technical indicators are improving significantly. The RSI has moved above the 50% level and MACD signal line crossed over to the upside. IMAC could have good upside potential, so watch the stock closely.

( click to enlarge )

TrovaGene Inc (NASDAQ:CRDF) Thin name but with an interesting chart pattern. We can see that the stock has continued to move sideways and has established somewhat of an ascending triangle formation as it continues to consolidate. The Hourly MACD is starting to curl and showed relative strength on Friday. Breakout watch over 1.29 (Short-term target 1.7)

( click to enlarge )

Milestone Pharmaceuticals Inc (NASDAQ:MIST) After a nice pullback to back-test the breakout area, it looks to me like this may have a move next week. Considering the strong momentum on Friday, the stock looks set to break higher and rise above its declining hourly EMA200.

( click to enlarge )

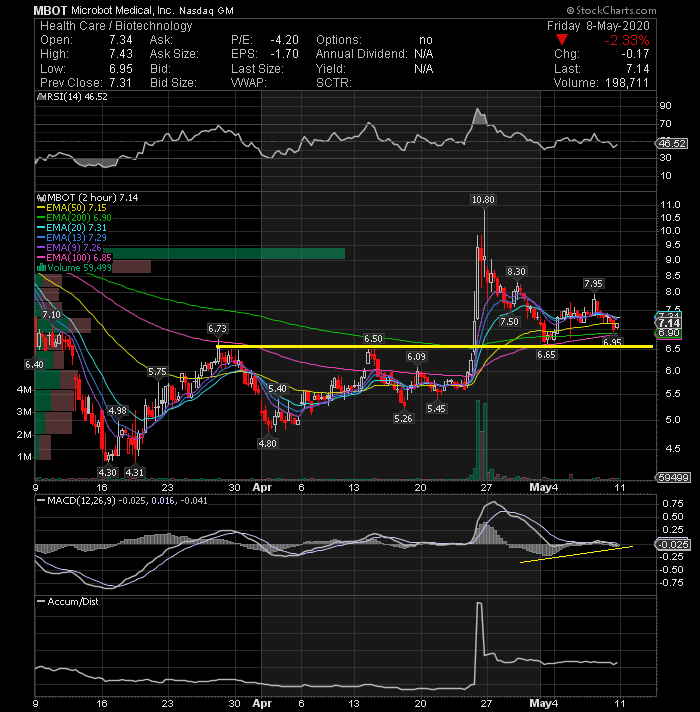
Microbot Medical Inc (NASDAQ:MBOT) I'm accumulating long positions again in the range of 6.9-7.25 levels for an immediate target of $9+ levels. With the stock price showing signs of bounce back, I believe that a short covering rally may be near. Watching action closely up here.

( click to enlarge )

Yield10 Bioscience Inc (NASDAQ:YTEN) Keep a close eye on this one next week. The stock price is showing signs of a bounce and next level of resistance according to this daily technical chart above is at 5.75 With good trading volume, the stock could be poised to trade higher to test its next level of resistence around 7.15

During the day I tweet many times to my readers. I encourage everybody to subscribe AC Investor Blog twitter and newsletter, so you can receive my trade ideas and stock news in real time.

Disclaimer : This is not an investment advisory, and should not be used to make investment decisions. Information in AC Investor Blog is often opinionated and should be considered for information purposes only. No stock exchange anywhere has approved or disapproved of the information contained herein. There is no express or implied solicitation to buy or sell securities. The charts provided here are not meant for investment purposes and only serve as technical examples. Don't consider buying or selling any stock without conducting your own due diligence.

Thanks for visiting AC Investor Blog.

AC

Labels: , , , , , , , , , , ,

Bookmark and Share

Saturday, April 18, 2020 

Top Swing Trade Ideas on my WL for the coming week

( click to enlarge )

Sigma Labs Inc. Common Stock (NASDAQ:SGLB) is a stock that could head higher from Friday's close. SGLB is in the process of bottoming and I expect a pop above $2.52 very soon. A breakout over this key resistance level with strong volume would send this flying targeting the pivot zone around $4 As i tweeted on Friday i took a long position. All key momentum indicators are starting to move north from oversold and MACD the more bullish as is ready to cross up zero and divergence. There looks to be good upside potential, so watch the stock very closely next week.

( click to enlarge )

Taronis Technologies Inc (NASDAQ:TRNX) Congratulations to those who took full advantage of Thursday’s pick, TRNX. It delivered nearly 75% potential gains and closed up near the day’s high on a monster volume. On Friday, the stock continued to trade up and traded all the way up to 50c before pulling back to close at 34c. Looking back, I see that I sold too early but my strategy/objective was met so I can't be greedy. We are taking about penny stocks when discipline and strategy needs to be combined. Penny stocks are risky, but if you know what you are doing, have the knowledge and expertise, and exercise caution when necessary as was the case, you stand to gain large return on relatively small investments, so a good strategy and discipline is needed to make sure you gain profits, thats it !! Technically, the stock seems to be forming a descending channel on the 4h chart, only a break and close above this channel, could endorse further bullish actions. Good luck, play smart with discipline.

( click to enlarge )

Astrotech Corporation (NASDAQ:ASTC) is starting to turn back up again after a healthy pullback and looks right on the verge of a strong breakout. If it breaks the 2.8 level on volume next week, the move could be powerful and the following uptrend will take price up to the recent highs around $4 Money flow remains positive which is bullish near term.

( click to enlarge )

Comstock Holding Companies Inc (NASDAQ:CHCI) has a very interesting daily technical chart as the stock looks to be ready for another upside move. All indicators are looking Bullish. Keep an eye for a possible breakout over 2.40 We all know how quickly this stock can move higher. I think we can see $2.80 rather quickly. I took a long position on Friday.

( click to enlarge )

Hepion Pharmaceuticals Inc (NASDAQ:HEPA) could have significant upside based on the recent CEO interview "People should pay attention to Hepion because this is a company that is truly undervalued".  On the technical side, the stock has been consolidating its big run from 1 to 2.86 in a large falling wedge formation. This is a bullish trend continuation chart pattern, indicating the continuation of an existing bullish trend after a small pause. The 1.35-1.4 area seems to be a strong support, so as long as the stock stays above that point there could be more upside ahead. If it does rally, I would look for it to at least rise back up to March highs around the $2.8 level.

( click to enlarge )

NovaBay Pharmaceuticals, Inc. (NYSEAMERICAN:NBY) is displaying a screaming buy divergence on the upside. A close above 88c will impart bullishness and will help the stock move to the $1.15 area.

( click to enlarge )

Boeing (NYSE:BA) Friday's action suggested that there is more room for the uptrend to grow on stock. Yesterday’s high was $154, which is resistance for the follow through move next week. If the stock does break resistance, expect to see another upside move. Short-term is bullish as the stock is now on top of its major short-term EMAs. So, keep an eye on it.

( click to enlarge )

Intelsat (NYSE:I) is in the process of bottoming and I expect a pop above $1.50 very soon. The option traders were active in this name buying a lot of calls (May $2).

( click to enlarge )

Ageagle Aerial Systems Inc (NYSEAMERICAN:UAVS) Im giving readers a stock that I have alerted in the past and had several times double digit gains in just one day. I rarely alert the same play more than once in a short period of time but UAVS is set up so perfectly for a big bounce that I cant resist. As you could see by the daily technical chart above, the stock has the potential to witness a significant uptick. Nearest resistance for the stock is at 60c If this level is crossed and the stock is able to sustain above this level, then it might go to 80c. Be sure to get it on your radars.

( click to enlarge )

Congratulations to those who took action on BIOC yesterday when i alerted at 39c on twitter. It performed AMAZING in the final hour to say the least. Stock needs to break the 48c level next week for a potential gap fill. To receive my FREE alerts before the crowd, follow me on Twitter.

During the day I tweet many times to my readers. I encourage everybody to subscribe AC Investor Blog twitter and newsletter, so you can receive my trade ideas and stock news in real time.

Disclaimer : This is not an investment advisory, and should not be used to make investment decisions. Information in AC Investor Blog is often opinionated and should be considered for information purposes only. No stock exchange anywhere has approved or disapproved of the information contained herein. There is no express or implied solicitation to buy or sell securities. The charts provided here are not meant for investment purposes and only serve as technical examples. Don't consider buying or selling any stock without conducting your own due diligence.

Thanks for visiting AC Investor Blog.

AC

Labels: , , , , , , , , ,

Bookmark and Share

Saturday, July 20, 2019 

A few chart setups for the coming days and trading rules

Dearest readers,

I would like to thank you all for your cooperation and support during these last few months of the year, with a high increase of followers on Stocktwits (76000) and a great increase in the number of followers on twitter that has almost reached 38000 followers. Then, announce that in the next 3 weeks I will be on vacation and will not be back to update the blog until 10th of August. But before I leave you, I added a few charts with potential trade ideas for the coming days and once again my trading rules for newbies. Good luck to all of you.

( click to enlarge )

Safe Bulkers, Inc. (NYSE: SB) jumped 24 cents, or 11.88%, Friday to 2.26, breaking out after consolidating for two weeks in a bullish flag formation. If the stock breaks Friday's high of the day in the 2.3 area, it could retest the November highs in the 2.6-2.7 area within the next couple of days. Momentum key indicators are in bullish mode on the daily chart.

( click to enlarge )

Blackberry (NYSE: BB) the daily chart above is showing a stock that could be making strides toward turning higher. The daily MACD is curling nicely and the current $6.85 - $7 area looks like a some solid support/interest. We could see a quick pop from these levels.

( click to enlarge )

Tonix Pharmaceuticals Holding Corp (NASDAQ: TNXP) is getting ready to come out of this base pattern. A close above 60c gets the party started. I would like to point out that while the stock is consolidating the accumulation line still rising, which means, someone is buying this dip.

( click to enlarge )

Bio-Path Holdings Inc (NASDAQ: BPTH) appears to have solid footing in the $13.25's and looks ready to test the $15's again.

( click to enlarge )

Kadmon Holdings Inc (NYSE: KDMN) has been in a strong upwards trend the past few weeks and is correcting some of the big gains while working out the overbought conditions. The 2.4 area level could provide a good entry point for short-term trades.

( click to enlarge )

AK Steel Holding (NYSE: AKS) seems to be a promising stock to follow in the coming days. The stock broke the downtrend line from the February peak of $3.29, which sets the stage for additional gains. Thing to watch out now for this stock is its resistance at 2.43 (declining EMA100), which if broken may give the possibility of it going to as high as 2.61 in short-term.

( click to enlarge )

Neptune Wellness Solutions Inc (NASDAQ: NEPT) is one of the hottest stocks in the market right now. The stock broke out to all time highs again last week and the volume was very strong, signaling that this move should hold. This is generally a hot buy from a technical perspective and the short-covering will continue to power the stock higher. The momentum clearly favors the bulls. The stock is now very overbought and it seems reasonable that it should rest. Technically a buy on any dip to the pivot zone.

( click to enlarge )

Dean Foods Co (NYSE: DF) broke the descending channel from the February highs on relative high volume and could eventually rally up to test its key resistance zone around the 1.5 area in the next sessions. In addition, MACD indicates positive momentum, while RSI is also gaining strength. Keep it on your watch list.

( click to enlarge )

Boeing (NYSE: BA) Volume is picking up but the stock needs to break this resistance zone first to me. If the stock can break out above $380 with heavy volume, I think the stock could shoot up to test $397 area. There looks to be good upside potential, so watch the stock very closely.

( click to enlarge )

Ameri Holdings Inc (NASDAQ: AMRH) is a penny stock I am watching closely. It can pop big time on any positive news. The stock is trading within an uptrend and in the short-term outlook it could rise to around 42c

( click to enlarge )

Nio Inc (NYSE: NIO) Coiling up here. A break through this 3.52 area could accelerate it higher.

( click to enlarge )

Vislink Technologies Inc (NASDAQ: VISL) was added to my watchlist as a possible bottom bounce-play for another possible swing trade. It is extremely oversold at this price level. Volume picked up a bit on Friday and the daily MACD is starting to curl up, suggesting that a positive crossover could be coming soon. Bargain hunters may want to accumulate here.

I decided to share you all followers again my basic trading rules that should be taken always in consideration for trading in order to become a successful trader in the stock market. 

1 - The trend is your friend, so never go against the trend. 
2 - Keep your losses small. Golden rule: Cut losses short. Let profits run. 
3 - Use stops. The stop loss should be placed few cents below the supports and not at the same level. 4 - Learn the basics of fundamentals, charts and technical indicators. 
5 - The good trader is one who makes consistent gains, so don’t be a greedy trader, appreciate the small and the big gains. 
6 - Do not fear the market. Be always confident in your trade decisions. 
7 - Never buy what you do not want, because you think it is cheap. 
8 - Always be conscious that the loss may arise and you should be prepared for that to happen. Open mind. 
9 - For large positions, you must to have total control of the market never losing sight 
10 - Volume is a leading indicator, so play the breakouts using the volume as support of your decision. 
11 - Chart breaks without volume could be a trap and the probabilities of succeeding are low 
12 - Do not be hasty to buy or sell a stock, every day there are new opportunities to make money. Be patient is the key of success of any trader. 
13 - Only believe fundamentals as long as the technical signals follow. 
14 - Trading very speculative stocks is a frequent mistake. 
15 - Do not trade positions too large relative to your available capital. 
16 - Do not invest all your money in one company. Your portfolio must be diversified. 
17 - The Greed to pick tops or bottoms is a usual error. Wait for the perfect and confirmed signal. 
18 - Do not make trading decisions based on a story you saw in the morning paper. The market many times has already discounted the information. 
19 - Review your missteps to improve your skills 

As i always say, with patience and discipline, you can take much more from the stock market than you ever gave. Trading stocks is not easy for beginners or professionals, it is really very hard and requires lot of attention and knowledge. If stock trading was easy, everyone would be doing it. You can be successful at the stock market, with patience, discipline and a good trade set-up. The key objective is to make money and not lose it.

During the day I tweet many times to my readers. I encourage everybody to subscribe AC Investor Blog twitter and newsletter, so you can receive my trade ideas and stock news in real time.

Disclaimer : This is not an investment advisory, and should not be used to make investment decisions. Information in AC Investor Blog is often opinionated and should be considered for information purposes only. No stock exchange anywhere has approved or disapproved of the information contained herein. There is no express or implied solicitation to buy or sell securities. The charts provided here are not meant for investment purposes and only serve as technical examples. Don't consider buying or selling any stock without conducting your own due diligence.

Thanks for visiting AC Investor Blog.

AC

Labels: , , , , , , , , , , ,

Bookmark and Share

Tuesday, June 13, 2017 

My Watchlist for Wednesday, June 14

( click to enlarge )

Aptose Biosciences Inc (NASDAQ:APTO) Breakout on huge volume. Congrats to those that took full advantage of my pick today. The stock closed up nearly 22% on heavy volume. Any pullback to the 200-EMA offers a low risk entry opportunity.

( click to enlarge )

Boeing Co (NYSE:BA) Poised to breakout to new highs.

( click to enlarge )

Rennova Health Inc (NASDAQ:RNVA) Looks like it is getting ready for a breakout soon.. Technicals are showing bullish signals supported by rising MACD and RSI on the daily charts. Look at volume at current levels. Big volume at bottom usually means bottom.

( click to enlarge )

I have been following ParkerVision, Inc. (NASDAQ:PRKR) for a few days now and surprisingly this stock showed some strength today. A break of $2.60 with force might give room to $3.5

( click to enlarge )

Honeywell International Inc.(NYSE:HON) Setting up nicely for new highs. Breakout Watch!

If you want to contact me for advertising opportunities on blog or twitter, then get in touch via email

Disclaimer : This is not an investment advisory, and should not be used to make investment decisions. Information in AC Investor Blog is often opinionated and should be considered for information purposes only. No stock exchange anywhere has approved or disapproved of the information contained herein. There is no express or implied solicitation to buy or sell securities. The charts provided here are not meant for investment purposes and only serve as technical examples. Don't consider buying or selling any stock without conducting your own due diligence.

Thanks for visiting AC Investor Blog.

AC

Labels: , , , ,

Bookmark and Share

Saturday, May 06, 2017 

My Watchlist for Monday, May 08

( click to enlarge )

BlackBerry Ltd (NASDAQ:BBRY) closed the week with a strong tone above the critical resistance level of 9.46 (the highs of December 2015). The stock has been trading in a strong up-trend momentum since late March, which remains technically intact. As you can see from the weekly momentum indicators on the chart above, they remain very constructive, suggesting that higher prices could unfold over the long term. The stock has been a nightmare for shorts in the past few weeks and I do believe that this rally could be just the beginning of something much bigger. The story of John Chen in Sybase was something EPIC, astounding, phenomenal, unbelievable, etc....for many analysts, and i got a feeling that Blackberry could be the next Sybase. As i have been saying, the more you short, the more you will need to cover. Double digits ahead.

( click to enlarge )

Home Depot Inc (NYSE:HD) has been trading in a strong up-trend over the past few months, which is still firmly intact. Over the past two weeks the price has been trading sideways, consolidating between $153 and $156. At this point, all you can do is to wait for the breakout of the trading range.

( click to enlarge )

Merck & Co., Inc. (NYSE:MRK) momentum is coming back to this name. Daily momentum indicators are pointing to likely higher prices over the medium-term. Once a resistance of $64.12 is broken upwards the price can rebound to $65

( click to enlarge )

Xenon Pharmaceuticals Inc (NASDAQ:XENE) has been range bound for awhile. Looks ready to take out 4.25 soon. Daily MACD looks favorable too. Im long.

( click to enlarge )

Boeing Co (NYSE:BA) Poised to breakout to new highs. A high volume move through the 185.71 price level would be buyable.

( click to enlarge )

Affimed NV (NASDAQ:AFMD) is ready for a possible rally if breakout key resistance level of $2.30 with big volume. It is possible the stock is forming a large Bullish Flag pattern. The MACD Histogram is also showing a positive divergence. On the radar. Plenty of room to upside.

If you want to contact me for advertising opportunities on blog or twitter, then get in touch via email

Disclaimer : This is not an investment advisory, and should not be used to make investment decisions. Information in AC Investor Blog is often opinionated and should be considered for information purposes only. No stock exchange anywhere has approved or disapproved of the information contained herein. There is no express or implied solicitation to buy or sell securities. The charts provided here are not meant for investment purposes and only serve as technical examples. Don't consider buying or selling any stock without conducting your own due diligence.

Thanks for visiting AC Investor Blog.

AC

Labels: , , , , ,

Bookmark and Share
Contact

About Me

    Photobucket
  • I'm a 48 year old Independent Trader using proprietary technical analysis with more than 20 years experience of investing in the US stock markets. I started this blog in 2006 simply as a way to share my thoughts about capital, risk management, and trading. My blog contains only my personal opinion and is provided for informational purposes only.

  • Benzinga.com supporter

    Benzinga.com supporter


    FREE NEWSLETTER

      Enter your email address:

      Delivered by FeedBurner

      Subscribe my feed :

    Support AC

    • Support AC Investor Blog, Donate with PayPal

    Advertising

      Interested in advertising on AC Investor Blog ? Click Here

    TRANSLATOR

    Site Information

    Stock Market Blogroll

    Friends BLOGROLL

    ARCHIVES

Powered by Blogger
and Blogger Templates


Add to Google