-Financial Tools Futures Market--TRADE IDEAS-- OPTION ALERTS -BENZINGA PRO-

Saturday, October 15, 2022 

Economy, Charts, Stocks and opportunities !!

Dearest readers, 

JUST TO REMEMBER: I would like to take this opportunity once again to remind you that I don't send private Twitter messages promoting services nor ask you for money. Plus, I don't have any TELEGRAM, FACEBOOK or INSTAGRAM accounts. 

I would also like to make clear that I have never been paid to promote a stock/company, and I never will. All of my stock picks, technical analysis, and posts are crafted utilizing my own knowledge and experience. 

I trade all types of stocks, big mid and small caps, but never the OTC market. I thank you for coming here and reading what I have to say about stocks on a technical level for informational purposes only.

Talking now about markets.......

The main US stock indexes ended the last session of the week in the red again, at a time when investors are trying to find a balance between fears of rising inflation, lower growth and cheaper share prices after the massive drops the past four weeks. I think we are moving towards a regime in which prices will remain at a higher level for some time. Economic growth has been showing a positive trend, since with the return of normality after COVID, we are witnessing a greater dynamism characterized by an increase in consumption. 

The question that is beginning to be asked is what will be the future economic performance and what growth revisions will be taken into account after the steep rise of the interest rates, which as a rule has negative consequences for economic growth. So far, the labor market remains robust. However, if economic growth slows down significantly and inflation remains high, the labor market should also be impacted. 

In the current context, and after a huge drop of the main indexes YTD the market is already priced in an economic contraction. I remain in complete disagreement with the FED policy decisions. They acted late and now they want to stop the problem immediately, having a brutal impact on consumers and possibly destroying jobs that last decades to be created.

Let me share some interesting setups to follow next week.

( click to enlarge )

Nio Inc (NYSE:NIO) bulls need to hold support at the 11.67 price level on a close basis next week. Breaking below it will increase chances of moving lower towards 11-10.5 area. Bulls need to form a higher low and then make another try to break the declining EMA9. There could be short-term, counter-trend movements, but for now the trend remains to the downside.

( click to enlarge )

Over the past week I have been accumulating shares of Advanced Micro Devices (NASDAQ:AMD) Since the beginning of August the stock is in the midst of an amazing fall, you would have to think it will get a decent dead cat bounce at some point. Just seven days ago someone was willing to pay $70 for this stock, that same person may be willing to pay $56 for it now, which would represent a decent recovery. Looking at the chart, the daily MACD is displaying a positive divergence, meaning that despite lower lows in price action, the MACD Hist is printing higher lows, indicating that the pair could move to the upside. If the stock holds the recent lows next week, there's a good chance for a bounce-back rally in the next few sessions.

( click to enlarge )

Atlis Motor Vehicles (NASDAQ:AMV) Low float stocks have been very HOT lately and this name should breakout at some point, I think it will be sooner rather than later, with a possible move coming next week. I am thinking $30 or better this time around. 

( click to enlarge )

Grove Collaborative Holdings Inc (NYSE:GROV) I can sense the capitulation and think that a sharp rally could follow over the next few days. At $1.6 a share, and considering this stock was trading well over $7 last month, the risk for further decline is outweighed by the potential gain an explosive bounce would provide. With Friday's closing price of $1.57, I think a quick bounce to $2.4 or better is in the cards.

( click to enlarge )

Tesla, Inc. (NASDAQ:TSLA) Unfortunately, I was stopped out yesterday. The daily technical chart looks a little worrying for the bulls at this point. It's a big problem when a stock fails to regain a key level. The stock’s $204.99 close on Friday also puts it firmly below the $206 level, which is significant since it was key support for the stock in the past. I might re-enter after the earnings, but for now I prefer to stay on the sidelines.

( click to enlarge )

Meta (NASDAQ:META) Another big cap that I have been accumulating recently. Although the market fell, this stock seems resilient. And resilience is one good way to know strength. Let's see if it holds the 52wk low and what next week brings us.

( click to enlarge )

Wisekey International Holding (NASDAQ:WKEY) has seen a massive drop in share price. Stocks with such a big fall and great news usually have big bounces. News out from WKEY last week could help bring out the knife catchers. Revenue grew for 4 straight Quarters and the partnership with the Swiss army worth millions. The time might be coming for a big bounce. A bounce that could send this stock back over $2.5

( click to enlarge )

Sidus Space (NASDAQ:SIDU) The technical daily chart shows a stock that is in a slow and steady down trend. The time for a significant bounce is near and more than likely coming next week if the market helps. On watch.

I got awesome news for you guys: The next 2-week Test Drive starts October 17th and ends October 31st. You are invited to test drive TradeIdeas PREMIUM features for 2 weeks by clicking HERE ! The Test Drive lets non-subscribers or standard subscribers enjoy all Premium Subscription features for up to 2-weeks. I recommend you sign up before Monday, October 17 so you have the full 2-weeks of access. You can sign up through Friday, October 17th but won't get the full 2-weeks.

Disclaimer : This is not an investment advisory, and should not be used to make investment decisions. Information in AC Investor Blog is often opinionated and should be considered for information purposes only. No stock exchange anywhere has approved or disapproved of the information contained herein. There is no express or implied solicitation to buy or sell securities. The charts provided here are not meant for investment purposes and only serve as technical examples. Don't consider buying or selling any stock without conducting your own due diligence.

Thanks for visiting AC Investor Blog.

AC

Labels: , , , , , , ,

Bookmark and Share

Monday, September 06, 2021 

Good looking chart setups to watch this week

( click to enlarge )

Camber Energy Inc (NYSEAMERICAN:CEI) This daily chart represents a stock under tremendous accumulation. From a technical standpoint, the stock is overbought but I see the momentum and price gains continuing through next week. If the stock continues to see buying pressure I could see it trading well over $1 in the short term. Penny stock on watch.

( click to enlarge )

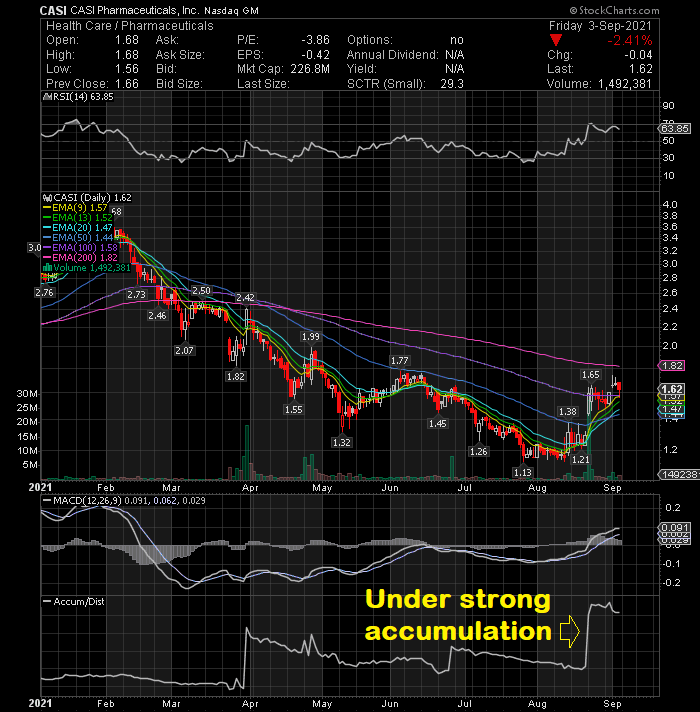
CASI Pharmaceuticals Inc (NASDAQ:CASI) The daily chart is shaping up and I expect the next point of resistance to be at $2.25. At some point CASI will take off and never look back. I think that day will come soon and those buying at these prices will be thanking me down the road. Oppenheimer analyst Leland Gershell recently raised the price target on CASI to $6.00 (from $5.00) while maintaining Outperform rating and the CEO purchased 480000 shares in August owning more than 5 million shares. I think CASI is heading higher from here and will make an excellent trade going forward.

( click to enlarge )

Exela Technologies Inc (NASDAQ:XELA) Volume has lightened up and the price is holding up nicely above the major short-term rising EMAs. This looks like the spot where the bulls will begin to make their move. From a technical standpoint, the stock may be ready to break out of this potential bullish flag consolidation while MACD is also starting to move higher. Only a close above 2.75 would suggest further upside. XELA will move quickly, so keep it on your screen.

( click to enlarge )

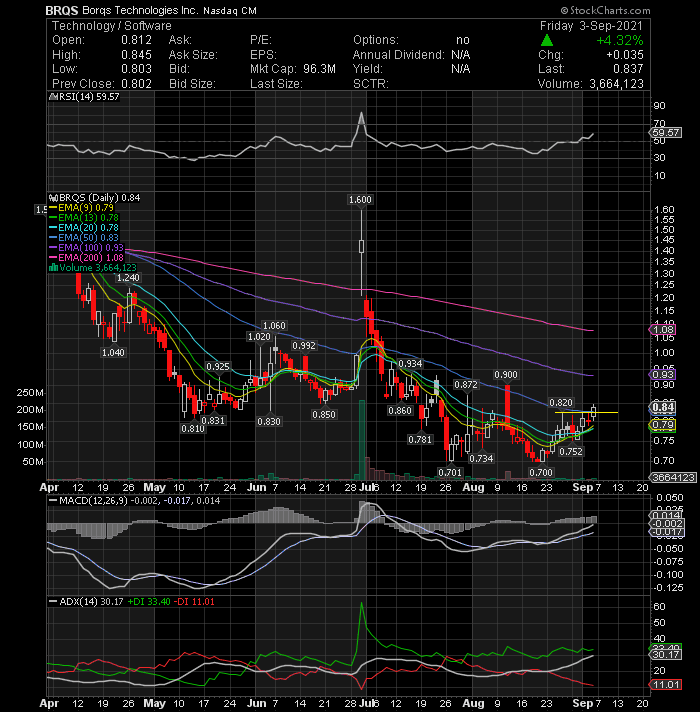
Borqs Technologies Inc (NASDAQ:BRQS) volume and price are on the rise and this stock is really getting some momentum behind it. The share price has finally crossed and closed above the declining 50-day EMA, which is very positive. All major short-term EMAs have started moving up, with the 9-day EMA above the 20-day EMA for the first time in more than 2 months. Friday’s intraday high of 0.845 was also the highest level the stock has touched in more than two weeks. The daily technical indicators are pointing to a continuation of the rally.

( click to enlarge )

Enveric Biosciences Inc (NASDAQ:ENVB) The buying was coming quickly on Friday for this stock. I am interested to see if it keeps going this week. It is on watch.

( click to enlarge )

Medavail Holdings Inc (NASDAQ:MDVL) I accumulated a lot of shares around $3 and the stock is paying off handsomely now. As I mentioned several times, the gap zone is my target. Let the profits run.

( click to enlarge )

Globalstar (NYSEAMERICAN:GSAT) The $2.42 area is a critical resistance region that can determine overall bias for the stock in the short-term. Bulls are now attacking the 2.25 price level, a break above could trigger a rally towards 2.42 resistance again. Keep an eye on these levels. Love the look of this hourly chart.

( click to enlarge )

Nio Inc (NYSE:NIO) is on the verge of a possible technical breakout. The stock closed slightly below the 50-day EMA on the daily chart. A breakout above this key EMA is a signal that there is a potential long-term trend change taking place. The strongest sign of a bullish momentum is the daily MACD indicator which has just started to increase. The RSI is also showing positive signs on the stock. On watch.

( click to enlarge )

Clover Health Investments Corp (NASDAQ:CLOV) The more it consolidates the bigger and strong run/squeeze it will have. On the technical side, MACD and ADX all point to an upward trend while RSI is also rising. Watch the stock closely on Tuesday, and once it breaks through $9, get ready to enter the trade.

Disclaimer : This is not an investment advisory, and should not be used to make investment decisions. Information in AC Investor Blog is often opinionated and should be considered for information purposes only. No stock exchange anywhere has approved or disapproved of the information contained herein. There is no express or implied solicitation to buy or sell securities. The charts provided here are not meant for investment purposes and only serve as technical examples. Don't consider buying or selling any stock without conducting your own due diligence.

Thanks for visiting AC Investor Blog.

AC

Labels: , , , , , , , ,

Bookmark and Share

Saturday, November 14, 2020 

Chart setups for the coming week


( click to enlarge )

The daily chart illustrates how Allied Healthcare Products Inc (NASDAQ:AHPI) recently broke out of a large falling wedge pattern on strong price action and volume accumulation, elevating the price above the 50-day Exponential Moving Average and the 20-day EMA. Yesterday corrective pullback printed an inside bar candlestick on low volume which most often precedes another strong movement. Inside bars show a period of consolidation in a stock or index. A daily chart inside bar will look like a triangle on a 1h or 30m chart time frame. They often form following a strong move in a stock/index as it pauses to consolidate before making its next move up in this particular case. This company manufactures a variety of respiratory care devices, medical gas construction equipment, and emergency medical products for use in hospitals and home health care. Combining the recent price action with the spread of Covid again at a fast pace and the HUGE demand for medical products, this stock should resume the upside move next week for a possible run to next major resistance at $10. AHPI will move quickly, so keep it on your screen on Monday.

( click to enlarge )

Valero Energy Corporation (NYSE:VLO) has been forming a bull flag chart pattern  since the big push up it had on Monday. The break and close above gives the buyers the confirmation. The technical daily indicators are looking bullish. The MACD is above its signal line in positive territory and the daily RSI is above its 65% level. Long setup on watch.

( click to enlarge )

Ocean Power Technologies Inc (NASDAQ:OPTT) stalking. I'd like to see this close over 1.75 before getting involved.

( click to enlarge )

Nio Inc - ADR (NYSE:NIO) has been forming a possible ascending broadening wedge pattern (bearish chart pattern) on the hourly chart, a setup that indicates increasing volatility in a stock. An ascending broadening wedge doesn't mark the exhaustion of the present buying pressure, but the sellers ambition to take control of the stock. Only breaking below the lower line of the pattern would be a good confirmation for the signal. Bulls need to hold the $40 level to expect further growth and avoid another sell-off.

( click to enlarge )

Westwater Resources Inc (NASDAQ:WWR) still watching it, especially after Friday's price action and decent volume. Like it above 4.59

( click to enlarge )

Phunware Inc (NASDAQ:PHUN) Investors hate this company due to its dilution history, but what they don't see is the stock could be poised for a possible turnaround. There is Bullish divergence, because the price is falling, while MACD is making higher lows and the supply is decreasing as time goes on. I have been accumulating this stock at current levels, lets see if i'm right again. Keep in mind, trading and investing both involve seeking profit in the stock market, but they pursue that goal in different ways. Trading is the skill of taking calculated risks when the probabilities are in our favour and by looking at the chart this seems to be the case. I see the stock on verge of breaking up out of this compression. My long-term indicators have signaled buy with bullish divergences, thus we can expect a rally to test the 80c resistance level soon. Keep it simple !!

( click to enlarge )

I think Sphere 3D Corp (NASDAQ:ANY) has found support around the $1.25-$1.30 range and looks poised to post a bounce from here. I could see a 25-35% possible bounce up to $1.80 - $2 a share if it can get past the resistance at $1.40. Its 52 week high is over $5 Watch the break of the upper line (1.40) of this descending channel for a strong move to the upside. MACD is finally crossing up and RSI is also turning back up, so momentum is yet to come.

( click to enlarge )

Precipio Inc (NASDAQ:PRPO) volume has dissipated and the share price per share has stabilized while indicators are turning up. Investors are awaiting more company news to decide if this stock is worthy of more accumulation. Honestly, I think now is the time to be getting into it ahead of any new positive developments. A break of the 2.22 level would be the impetus for a more explosive move higher. On watch.

( click to enlarge )

China Recycling Energy Corporation Common Stock (NASDAQ:CREG) printed a strong reversal candle on solid volume. If the stock can break Friday's high, I think we will rally back to the $5 level.

( click to enlarge )

Fisker Inc. (NYSE:FSR) broke out of an important consolidation area with a long white candlestick on Friday. Will watch to see if it can break this horizontal resistance line. You really have to like the way this stock has been trading.

During the day I tweet many times to my readers. I encourage everybody to subscribe AC Investor Blog twitter and newsletter, so you can receive my trade ideas and stock news in real time.

Disclaimer : This is not an investment advisory, and should not be used to make investment decisions. Information in AC Investor Blog is often opinionated and should be considered for information purposes only. No stock exchange anywhere has approved or disapproved of the information contained herein. There is no express or implied solicitation to buy or sell securities. The charts provided here are not meant for investment purposes and only serve as technical examples. Don't consider buying or selling any stock without conducting your own due diligence.

Thanks for visiting AC Investor Blog.

AC

Labels: , , , , , , , , ,

Bookmark and Share

Sunday, November 01, 2020 

Charts on my watchlist for next week


( click to enlarge )

The technical daily chart set-up for Goosehead Insurance Inc (NASDAQ:GSHD) appears to be near perfect to deliver gains next week. The stock closed up 14.5% Friday accompanied by strong volume, momentum, outperforming the entire sector and broken out to all time highs. Go long on the break of Friday’s high at 124.84

( click to enlarge )

Adamis Pharmaceuticals Corp (NASDAQ:ADMP) took a big long position on Friday. The company has an upcoming catalyst that could rally the stock in the shorter term. PDUFA date November 15 for ZIMHI (naloxone HCI Injection) Opioid overdose. At oversold conditions and with a strong accumulation on the daily chart, I decided to start buying shares on Friday for a possible big bounce from current levels. Risk/reward seems favorable. Short-term target 1-1.10

( click to enlarge )

Small cap stock traders are always on the look-out for a low float / RS stock that has fallen so far that it is well overdue for a bounce. These types of stocks almost always rebound sharply. With just 833K float, I think Globus Maritime Ltd (NASDAQ:GLBS) has found support around the $7-$7.30 range and looks poised to post a bounce from here. We could see a possible bounce up to $11.5 a share or more if it can get past the resistance at $7.80 November is a good month for shippers historically. Definitely on high alert. Im long.

( click to enlarge )

Adial Pharmaceuticals Inc (NASDAQ:ADIL) looks like it may have found a bottom already. The technical daily indicators are looking better for the stock with MACD indicator above its sell signal line, %K line on top of %D line and RSI indicator moving up from the 40 level. I like the potential of this COVID name (Rapid antibody tests). At $1.74 a share, and considering this stock was trading well over $4 in September the risk for further decline is outweighed by the potential gain an explosive bounce would provide. I'm long for next week.

( click to enlarge )

Thermogenesis Holdings Inc (NASDAQ:THMO) is trying to regain the ground that it lost last week. From a technical perspective, the stock has the opportunity to start a new rally as the %K line is back above the %D line and MACD is curling up. COVID name (2-10 minutes Antibody test). If it breaks $2.24 it will absolutely fly into the 2.8 area right away.

( click to enlarge )

Digital Ally, Inc. (NASDAQ:DGLY) had a bearish momentum on Friday but closed again above the rising 200-day EMA. There are no changes in my technical outlook. The 200 and 100-day EMAs are rising and the stock is trading above them. Until proven otherwise, my bias is to the upside. I still prefer a bullish scenario but need at least a movement above 2.69 to end the current bearish correction. Long setup on watch. 

( click to enlarge )

Peck Company Holdings Inc (NASDAQ:PECK) is on track to test and potentially overcome the $7.5 zone resistance in the days ahead. MACD has turned up and RSI has plenty of room to support higher prices. Buying momentum is still positive and strengthening.

( click to enlarge )

XpresSpa Group Inc (NASDAQ:XSPA) is a potential bottom-play candidate for next week and might bring some good scalping opportunities to the 2.20 level again. Stochastics are triggering reversal and MACD is showing signs of bottoming. On watch.

( click to enlarge )

Bio-Path Holdings Inc (NASDAQ:BPTH) lost 50% in just a few days on positive news and low volume. Another potential V-SHAPE bounce coming imho. This bio cancer stock is trading at BARGAIN prices. Take the advantage of the pullback. I have been accumulating shares. I want to double my money again here.

( click to enlarge )

Phio Pharmaceuticals Corp (NASDAQ:PHIO) On Monday, the company announced 3 Poster Presentations at the 2020 Society for Immunotherapy of Cancer (SITC) Annual Meeting and we saw last week unusual volume and price action on warrants. I believe that someone is making a bullish bet on the upcoming updates and I'm following the smart money. I took a big position and will increase on the break of 2.50

( click to enlarge )

Canaan Inc (NASDAQ:CAN) had a strong bullish momentum on Friday. The bias is now slightly bullish in the near term. If the stock can stay above the 50-day EMA, then it has potential to rebound to $2.36 resistance initially then $2.75

( click to enlarge )

Nio Inc  (NYSE:NIO) The technical chart suggests that the pullback on Friday is not a change of trend, but it is instead just a temporary retreat to workout the overbought conditions. As long as the stock stays/consolidates above $29.4 on a closing basis, the bias remains to the upside.

During the day I tweet many times to my readers. I encourage everybody to subscribe AC Investor Blog twitter and newsletter, so you can receive my trade ideas and stock news in real time.

Disclaimer : This is not an investment advisory, and should not be used to make investment decisions. Information in AC Investor Blog is often opinionated and should be considered for information purposes only. No stock exchange anywhere has approved or disapproved of the information contained herein. There is no express or implied solicitation to buy or sell securities. The charts provided here are not meant for investment purposes and only serve as technical examples. Don't consider buying or selling any stock without conducting your own due diligence.

Thanks for visiting AC Investor Blog.

AC

Labels: , , , , , , , , ,

Bookmark and Share

Sunday, July 19, 2020 

Potential swing trade ideas for the week ahead

( click to enlarge )

This stock is lining up for a serious bull run and it has the potential to become one of the most explosive breakout play opportunities of the month. I continue to support the idea of a significant rally on shares of  Arca Biopharma Inc (NASDAQ: ABIO), probably even above the June highs. We still need to see a break and close above 7.80 to confirm a continuation to the upside with a next target in the 10 area. Due to its low float a parabolic move is also not out of the question. Daily technical indicators are beginning to turn bullish. MACD is about to cross the signal line, which indicates that the bulls are trying to take over and RSI has moved above its 50% level. There looks to be good upside potential, so watch the stock very closely next week.

( click to enlarge )

Ideanomics Inc (NASDAQ:IDEX) is showing signs of a potential upside recovery. MACD has stabilized and is crossing over its signal line. The August $1 call options have been very active. Next week watch the resistance at 1.43. A close above will be bullish and may test 1.76/2.0

( click to enlarge )

BioNTech SE (NASDAQ:BNTX) Flagging here. The buy/add point would be when it breaks over 87.58 on volume.

( click to enlarge )

Arcadia Biosciences Inc (NASDAQ:RKDA) displayed relative strength on Friday and broke out above resistance at the $3.75 level on solid volume. The 4h 20EMA has been a strong resistance for days. Watching if this can go into $4.5's next week.

( click to enlarge )

Nio Inc (NYSE:NIO) After a great run in the first half of July, the stock has been in a correction mode. $10.46 is strong short-term support. If the stock holds the support then expect a good rally towards the level of $12 and then $12.45. On the 30m chart the MACD triggered a new buy signal as the momentum indicator crossed above its signal line. On the other hand, if the stock breaks the support on volume, it can go down again to 9.5 (closing gap). Definitely on watch next week.

( click to enlarge )

I feel Sundance Energy Inc (NASDAQ:SNDE) is on the verge of a big bounce from these cheap levels. The stock has formed a large falling wedge in the last few weeks and is showing signs of bullishness. I would look for a move up to $3.25 in the coming sessions. If it passes that, there is very strong resistance at $4 coming up next.

( click to enlarge )

Hepion Pharmaceuticals Inc (NASDAQ:HEPA) closed up 10% on Friday and strong momentum appears to be building rapidly. The stock price broke out of a base formation on decent volume and could eventually rally up to test the 4.80 resistance zone again. HEPA has seen huge gains over short periods in the past and I believe this breakout could trigger another bull run. From a technical standpoint, the positive momentum seems to be back as the stock is back above the major medium-term EMAs with the RSI going up and MACD in the positive territory.

( click to enlarge )

FORESIGHT AUTON/S (NASDAQ:FRSX) is forming a large ascending triangle formation on the daily chart, which is usually bullish and could end up in a price spike on the break.

( click to enlarge )

SPARTAN ENERGY /SH (NYSE:SPAQ) has found a bottom here and looks poised to post a rally from current levels. We start to see some signals of rebound as the technical chart shows positive momentum is back. If stock breaks 15.81 then the stock can head to 18 and if this level is breached then the level of 21.5 is visible. Long setup on watch.

( click to enlarge )

Urban One Inc Class D (NASDAQ:UONEK) Still on TOP of my watchlist. Key resistance is located at $1.78, a break above this level will confirm a new bullish trend and the following uptrend will take the price up to the $2.5 zone. The MACD is turning up, which is a sign of growing strength in the stock. I think it's worth adding to your watchlist.

( click to enlarge )

JAKKS Pacific, Inc. (NASDAQ:JAKK) well-positioned as a bottom bounce play at 5.90 a share. I know that it is too early to say for certain but looking at the chart above is very likely. The stock took a big drop in just a few weeks, and is presently trading at levels very low. It's hard to believe, but the share price is now 50% cheaper than was in June and trading in oversold conditions. If it starts to move above $6 with strong volume, that will be an indication of a bounce. Keep JAKK in your watchlist.

During the day I tweet many times to my readers. I encourage everybody to subscribe AC Investor Blog twitter and newsletter, so you can receive my trade ideas and stock news in real time.

Disclaimer : This is not an investment advisory, and should not be used to make investment decisions. Information in AC Investor Blog is often opinionated and should be considered for information purposes only. No stock exchange anywhere has approved or disapproved of the information contained herein. There is no express or implied solicitation to buy or sell securities. The charts provided here are not meant for investment purposes and only serve as technical examples. Don't consider buying or selling any stock without conducting your own due diligence.

Thanks for visiting AC Investor Blog.

AC

Labels: , , , , , , , , , ,

Bookmark and Share
Contact

About Me

    Photobucket
  • I'm a 48 year old Independent Trader using proprietary technical analysis with more than 20 years experience of investing in the US stock markets. I started this blog in 2006 simply as a way to share my thoughts about capital, risk management, and trading. My blog contains only my personal opinion and is provided for informational purposes only.

  • Benzinga.com supporter

    Benzinga.com supporter


    FREE NEWSLETTER

      Enter your email address:

      Delivered by FeedBurner

      Subscribe my feed :

    Support AC

    • Support AC Investor Blog, Donate with PayPal

    Advertising

      Interested in advertising on AC Investor Blog ? Click Here

    TRANSLATOR

    Site Information

    Stock Market Blogroll

    Friends BLOGROLL

    ARCHIVES

Powered by Blogger
and Blogger Templates


Add to Google