Top Twelve trading ideas for the coming week - A BIG THANK YOU to all of you 85000 followers on Stocktwits
Dearest Readers,
I would like to thank you for your cooperation and support during the last few weeks, with a high increase of followers on the blog and a great increase in the number of followers on twitter that has almost reached 50,000 followers. As some of you may have noticed, last week I hit 85,000 followers on Stocktwits which was a huge achievement for me. A BIG THANK YOU to all of you.

( click to enlarge )
The hourly chart of Creative Realities Inc (NASDAQ:CREX) broke out of a bull flag pattern to the upside Friday on solid volume, which is very bullish. Technical indicators are still looking bullish. Hourly MACD is positive and rising above its signal line. RSI has moved above its 50% level after a healthy correction. Watch for a good follow through day on Monday. Any breakout above the 2.94 level on closing basis may take the stock close to 3.5 and beyond that the 4 area. Stop 2.25


( click to enlarge )
On the daily chart, Boeing (NYSE:BA) has been forming a descending triangle, which in most cases results in a price breakdown. The nearest level of resistance lies at the upper boundary of the triangle now located at $143. If the bulls break up the triangle on solid volume, will invalidate the descending triangle pattern and indicates to the investors that the stock is ready to head higher. On the flip side, the major support lies at the lower boundary of the triangle located around the $120 area. Key momentum indicators are inside their respective oversold zones. Daily MACD is rising above its signal line in negative territory and the daily RSI is trading slightly below the 50 level. If we would like to see a positive breakout, we would need the daily RSI to rise above the 50 level and continue higher. Definitely on watch next week.


( click to enlarge )
CHEK remains on my top penny watchlist. I have been accumulating this stock over the past days like i did with MARK in March. Looking at the chart, the accumulation is impressive and this, in my view, bodes well for the stock. In addition, the direct offering reported on Friday 12% above the Friday's close, reinforced my conviction that institutions have been massively buying this stock at current levels. These are facts, not speculation. I play what i see, not what is written on the stars. From a technical standpoint, daily technical indicators have formed bullish rounding bottom patterns inside their respective oversold zones. Plus, the strong volumes and sharp volatility in the past few trading sessions indicate uncertainty by investors, which often precedes a trend change. Im looking for an initial run to 63c then $1 is a possibility. Im still long.


( click to enlarge )
If Verastem Inc (NASDAQ:VSTM) can break out above $2.04 with heavy volume, I think the stock could shoot up to test the $3 area. There looks to be good upside potential, so watch the stock very closely next week. Still on my top watchlist.


( click to enlarge )
SAFE T GRP LTD/S ADR (NASDAQ:SFET) looks about ready to pop here! The stock is picking up momentum and could make a good upside very soon. The trend indicator daily MACD has triggered a fresh buy signal as it curved upward and crossed above its signal line. OBV continues to make higher highs and indicates that there is solid buying of the stock on positive days. The price needs to break Friday's high of $1.33 to expect a strong rally at this point. This stock has a history of big rallies, so I took a strong position on Friday for a possible new rally to +$2


( click to enlarge )
Co-Diagnostics Inc (NASDAQ:CODX) jumped 5% on Friday finishing the session near the highs of the day on high volume, suggesting buyers are stepping in. The move puts this stock in high probability of a breakout above key resistance in the $15.7 area. If the stock breaks and closes above the neckline of this inverted Head and Shoulders pattern there's a good opportunity to go long and follow the uptrend. Long setup on watch.


( click to enlarge )
Remark Holdings Inc (NASDAQ:MARK) With a run of over 400% since March lows (i started accumulating and alerted this stock in late March), it makes sense that we look at the current valuation of the stock for signs of a possible pullback, and Friday's candle is telling us something. The stock seems to have formed a possible Spinning Top candlestick chart pattern. This is a type of formation that occurs when buyers and sellers balance each other out, resulting in similar opening and closing price levels. On the other hand, the daily RSI is also showing lower highs as shown by the trendline. This could be an additional confirmation, that the current trend might reverses here or at least pulls back a little bit before the uptrend continues. I know that Bulls will not agree with me, but it is what it is and a pullback could be perfectly normal. Note: Currently i don't own any shares, i sold all my position with more than 100% gains.


( click to enlarge )
I have been watching IMAC Holdings Inc (NASDAQ:IMAC) over the past few days, waiting for a possible upside move. The stock seems to have found a strong support at present levels. The daily technical indicators are improving significantly. The RSI has moved above the 50% level and MACD signal line crossed over to the upside. IMAC could have good upside potential, so watch the stock closely.


( click to enlarge )
TrovaGene Inc (NASDAQ:CRDF) Thin name but with an interesting chart pattern. We can see that the stock has continued to move sideways and has established somewhat of an ascending triangle formation as it continues to consolidate. The Hourly MACD is starting to curl and showed relative strength on Friday. Breakout watch over 1.29 (Short-term target 1.7)

Disclaimer : This is not an investment advisory, and should not be used to make investment decisions. Information in AC Investor Blog is often opinionated and should be considered for information purposes only. No stock exchange anywhere has approved or disapproved of the information contained herein. There is no express or implied solicitation to buy or sell securities. The charts provided here are not meant for investment purposes and only serve as technical examples. Don't consider buying or selling any stock without conducting your own due diligence.
Thanks for visiting AC Investor Blog.
AC

( click to enlarge )
Milestone Pharmaceuticals Inc (NASDAQ:MIST) After a nice pullback to back-test the breakout area, it looks to me like this may have a move next week. Considering the strong momentum on Friday, the stock looks set to break higher and rise above its declining hourly EMA200.

During the day I tweet many times to my readers. I encourage everybody to subscribe AC Investor Blog twitter and newsletter, so you can receive my trade ideas and stock news in real time.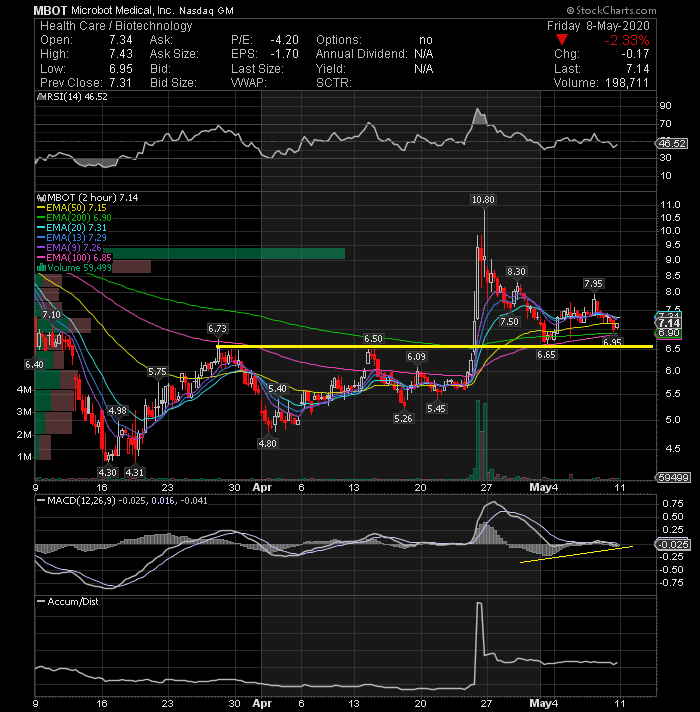
( click to enlarge )
Microbot Medical Inc (NASDAQ:MBOT) I'm accumulating long positions again in the range of 6.9-7.25 levels for an immediate target of $9+ levels. With the stock price showing signs of bounce back, I believe that a short covering rally may be near. Watching action closely up here.


( click to enlarge )
Yield10 Bioscience Inc (NASDAQ:YTEN) Keep a close eye on this one next week. The stock price is showing signs of a bounce and next level of resistance according to this daily technical chart above is at 5.75 With good trading volume, the stock could be poised to trade higher to test its next level of resistence around 7.15
Disclaimer : This is not an investment advisory, and should not be used to make investment decisions. Information in AC Investor Blog is often opinionated and should be considered for information purposes only. No stock exchange anywhere has approved or disapproved of the information contained herein. There is no express or implied solicitation to buy or sell securities. The charts provided here are not meant for investment purposes and only serve as technical examples. Don't consider buying or selling any stock without conducting your own due diligence.
Thanks for visiting AC Investor Blog.
AC
Labels: BA, CHEK, CODX, CRDF, CREX, IMAC, MARK, MBOT, MIST, SFET, VSTM, YTEN

| Permalink | 






