-Financial Tools Futures Market--TRADE IDEAS-- OPTION ALERTS -BENZINGA PRO-

Saturday, September 05, 2020 

Some trade ideas for the week ahead

( click to enlarge )

Tesla, Inc. (NASDAQ:TSLA) Yesterday I took a long position around the 379 level and was expecting to hold into next week but exited with a small profit in after-hours because the company was excluded from a group of companies being added to the S&P 500, something that honeslty i think nobody was expecting. From a technical standpoint, the stock has been in a beautiful up-channel over the last five months, nearly quintupling its value  since mid-March. However, in the short-term, we are seeing some bearish signs which indicate that the price is set to retrace if bulls don't manage the situation. The stock has a strong support around the 350 area (lower band of the up-channel), only a break of this key support will indicate the willingness of sellers to continue the decline to 300. For this scenario to develop, a noticeable weakness of the Tech sector is required. I will continue to trade it accordingly.

( click to enlarge )

Blackberry (NYSE:BB) On a daily timeframe, it looks like the stock could be forming a cup-and-handle pattern nearing the end of completion. After it broke higher late in May, it spiked higher to a high of 5.84 then the stock pulled back to near the 4.50 level and began a rounding bottom formation back towards the highs. Last week the stock retraced back to near the 4.80 and appears to be currently putting in the handle portion of the cup-and-handle formation. Typically, the stock goes up when the handle is formed. Let's wait and see. The pattern is only confirmed once the price breaches the neckline. Long setup on watch.

( click to enlarge )

Cemtrex Inc (NASDAQ:CETX) is currently forming a large falling wedge pattern indicated by the two non parallel yellow lines in the chart above, with resistance at about $1.25 while the accumulation line is rising. Watch closely on CETX because a breakout from the current chart pattern will trigger a big move for the stock. As I tweeted yesterday, I took a long position on Friday.

( click to enlarge )

CBAK Energy Technology Inc (NASDAQ:CBAT) had a big day on Friday, testing resistance in a move up 6c, or 9.7%, to 72c on decent volume. Tesla's Battery Day event will take place on September 22, so it's certainly expected that volume and price will rise into the event. Watch for a break of the 75c level to further accelerate prices. I have been accumulating the stock in anticipation.

( click to enlarge )

Boxlight Corp (NASDAQ:BOXL) has had a hard time with this resistance, but may be ready to move higher. The level which the stock may have trouble moving above, is at $1.86. It would need to break above that level to run to $2.68. MACD is curling up and the Slow stochastic is showing positive crossover, signs that support the bullish expectations. The reversal seems especially likely to continue. Long setup on watch.

( click to enlarge )

Polar Power Inc (NASDAQ:POLA) is another stock I'm watching closely. It can pop big time on any positive news. After drifting for weeks, the stock price seems to have found a bottom. Friday’s high was $1.67, which is resistance for the follow through move. If the stock can break through this level next week, expect to see heavy volume drive the stock higher. Next major resistance lies at 2.05

( click to enlarge )

Co-Diagnostics Inc (NASDAQ:CODX) was also added to my watchlist as a possible bottom bounce-play. The daily technical chart is displaying positive divergences on momentum indicators and with the stock in extreme oversold territory, these are the perfect conditions for a short-term rally. On watch.


Trade Ideas is one of the Top Scanning Tools available that i use everyday and they are running a Labor Day Sale and the code is good through Tuesday, September 8th! It's a 20% discount code. Use the code LABORDAY2020 to save 20% off the first month or year of any subscription. Click HERE

During the day I tweet many times to my readers. I encourage everybody to subscribe AC Investor Blog twitter and newsletter, so you can receive my trade ideas and stock news in real time.

Disclaimer : This is not an investment advisory, and should not be used to make investment decisions. Information in AC Investor Blog is often opinionated and should be considered for information purposes only. No stock exchange anywhere has approved or disapproved of the information contained herein. There is no express or implied solicitation to buy or sell securities. The charts provided here are not meant for investment purposes and only serve as technical examples. Don't consider buying or selling any stock without conducting your own due diligence.

Thanks for visiting AC Investor Blog.

AC

Labels: , , , , , ,

Bookmark and Share

Saturday, May 09, 2020 

Top Twelve trading ideas for the coming week - A BIG THANK YOU to all of you 85000 followers on Stocktwits

Dearest Readers, 

I would like to thank you for your cooperation and support during the last few weeks, with a high increase of followers on the blog and a great increase in the number of followers on twitter that has almost reached 50,000 followers. As some of you may have noticed, last week I hit 85,000 followers on Stocktwits which was a huge achievement for me. A BIG THANK YOU to all of you.

( click to enlarge )

The hourly chart of  Creative Realities Inc (NASDAQ:CREX) broke out of a bull flag pattern to the upside Friday on solid volume, which is very bullish. Technical indicators are still looking bullish. Hourly MACD is positive and rising above its signal line. RSI has moved above its 50% level after a healthy correction. Watch for a good follow through day on Monday. Any breakout above the 2.94 level on closing basis may take the stock close to 3.5 and beyond that the 4 area. Stop 2.25

( click to enlarge )

On the daily chart, Boeing (NYSE:BA) has been forming a descending triangle, which in most cases results in a price breakdown. The nearest level of resistance lies at the upper boundary of the triangle now located at $143. If the bulls break up the triangle on solid volume, will invalidate the descending triangle pattern and indicates to the investors that the stock is ready to head higher. On the flip side, the major support lies at the lower boundary of the triangle located around the $120 area. Key momentum indicators are inside their respective oversold zones. Daily MACD is rising above its signal line in negative territory and the daily RSI is trading slightly below the 50 level. If we would like to see a positive breakout, we would need the daily RSI to rise above the 50 level and continue higher. Definitely on watch next week.

( click to enlarge )

CHEK remains on my top penny watchlist. I have been accumulating this stock over the past days like i did with MARK in March. Looking at the chart, the accumulation is impressive and this, in my view, bodes well for the stock. In addition, the direct offering reported on Friday 12% above the Friday's close, reinforced my conviction that institutions have been massively buying this stock at current levels. These are facts, not speculation. I play what i see, not what is written on the stars. From a technical standpoint, daily technical indicators have formed bullish rounding bottom patterns inside their respective oversold zones. Plus, the strong volumes and sharp volatility in the past few trading sessions indicate uncertainty by investors, which often precedes a trend change. Im looking for an initial run to 63c then $1 is a possibility. Im still long.

( click to enlarge )

If Verastem Inc (NASDAQ:VSTM) can break out above $2.04 with heavy volume, I think the stock could shoot up to test the $3 area. There looks to be good upside potential, so watch the stock very closely next week. Still on my top watchlist. 

( click to enlarge )

SAFE T GRP LTD/S ADR (NASDAQ:SFET) looks about ready to pop here! The stock is picking up momentum and could make a good upside very soon. The trend indicator daily MACD has triggered a fresh buy signal as it curved upward and crossed above its signal line. OBV continues to make higher highs and indicates that there is solid buying of the stock on positive days. The price needs to break Friday's high of $1.33 to expect a strong rally at this point. This stock has a history of big rallies, so I took a strong position on Friday for a possible new rally to +$2

( click to enlarge )

Co-Diagnostics Inc (NASDAQ:CODX) jumped 5% on Friday finishing the session near the highs of the day on high volume, suggesting buyers are stepping in. The move puts this stock in high probability of a breakout above key resistance in the $15.7 area. If the stock breaks and closes above the neckline of this inverted Head and Shoulders pattern there's a good opportunity to go long and follow the uptrend. Long setup on watch.

( click to enlarge )

Remark Holdings Inc (NASDAQ:MARK) With a run of over 400% since March lows (i started accumulating and alerted this stock in late March), it makes sense that we look at the current valuation of the stock for signs of a possible pullback, and Friday's candle is telling us something. The stock seems to have formed a possible Spinning Top candlestick chart pattern. This is a type of  formation that occurs when buyers and sellers balance each other out, resulting in similar opening and closing price levels. On the other hand, the daily RSI is also showing lower highs as shown by the trendline. This could be an additional confirmation, that the current trend might reverses here or at least pulls back a little bit before the uptrend continues. I know that Bulls will not agree with me, but it is what it is and a pullback could be perfectly normal. Note: Currently i don't own any shares, i sold all my position with more than 100% gains.

( click to enlarge )

I have been watching IMAC Holdings Inc (NASDAQ:IMAC) over the past few days, waiting for a possible upside move. The stock seems to have found a strong support at present levels. The daily technical indicators are improving significantly. The RSI has moved above the 50% level and MACD signal line crossed over to the upside. IMAC could have good upside potential, so watch the stock closely.

( click to enlarge )

TrovaGene Inc (NASDAQ:CRDF) Thin name but with an interesting chart pattern. We can see that the stock has continued to move sideways and has established somewhat of an ascending triangle formation as it continues to consolidate. The Hourly MACD is starting to curl and showed relative strength on Friday. Breakout watch over 1.29 (Short-term target 1.7)

( click to enlarge )

Milestone Pharmaceuticals Inc (NASDAQ:MIST) After a nice pullback to back-test the breakout area, it looks to me like this may have a move next week. Considering the strong momentum on Friday, the stock looks set to break higher and rise above its declining hourly EMA200.

( click to enlarge )

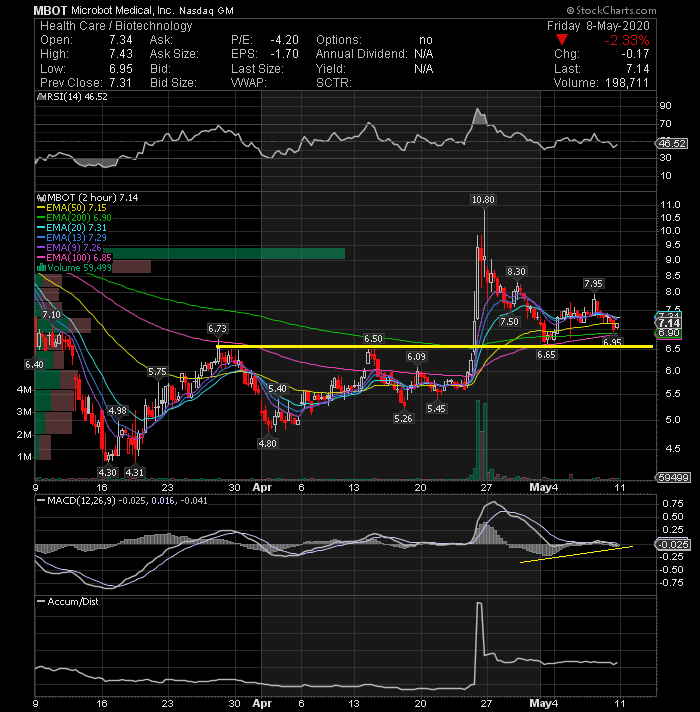
Microbot Medical Inc (NASDAQ:MBOT) I'm accumulating long positions again in the range of 6.9-7.25 levels for an immediate target of $9+ levels. With the stock price showing signs of bounce back, I believe that a short covering rally may be near. Watching action closely up here.

( click to enlarge )

Yield10 Bioscience Inc (NASDAQ:YTEN) Keep a close eye on this one next week. The stock price is showing signs of a bounce and next level of resistance according to this daily technical chart above is at 5.75 With good trading volume, the stock could be poised to trade higher to test its next level of resistence around 7.15

During the day I tweet many times to my readers. I encourage everybody to subscribe AC Investor Blog twitter and newsletter, so you can receive my trade ideas and stock news in real time.

Disclaimer : This is not an investment advisory, and should not be used to make investment decisions. Information in AC Investor Blog is often opinionated and should be considered for information purposes only. No stock exchange anywhere has approved or disapproved of the information contained herein. There is no express or implied solicitation to buy or sell securities. The charts provided here are not meant for investment purposes and only serve as technical examples. Don't consider buying or selling any stock without conducting your own due diligence.

Thanks for visiting AC Investor Blog.

AC

Labels: , , , , , , , , , , ,

Bookmark and Share

Saturday, April 04, 2020 

Trade Ideas for next week, Trading rules and some good FREE sources of information

Dearest followers, 

We are living in difficult times, waging a war against a faceless enemy and, although far from each other, we need to be more united than ever respecting the rules of health. The situation is very serious and people need to stay at home. Remember to wash your hands several times a day a day for at least 20 seconds to stop the spread of infectious diseases and encourage others to do the same.

Over the last days, I have received many emails, from  people asking me which books or sites I would recommend to learn about trading. To be transparent and direct, i cant find any book that could help you in this environment of uncertainity. In reality, there is no such thing as a perfect trading model, simply because the market is so dynamic and unpredicatable. Thats a good one for daytraders with experience (that doesnt mean they cant lose money) but not for newbies. However, i can share with you my trading rules and some good FREE sources. 

First the charts to watch next week, then the rules and sources.

( click to enlarge )

Co-Diagnostics Inc (NASDAQ:CODX) caught my attention on Friday afternoon few minutes before the close because of the price action and volume. Plus, the daily technical set-up was so perfect that could be a great trading idea for the coming week. So, i decided to enter and tweeted my entry. Few hours later i was surprised with the price action in after-hours. The stock shot up beautifully for a quick and easy 30% gains. Congrats to those who jumped into the game. Call luck, or whatever you want, but the bottom line is that i detected significant buy interest, something that caught my attention so i decided to enter. Luck is part of the experience.

( click to enlarge )

Ocean Bio-Chem, Inc. (NASDAQ:OBCI) bounced beautifully off the uptrend line on the hourly chart so I bought back my shares on Friday. The stock has been trading up in a clear bullish pattern (higher highs, and higher lows) since establishing a bottom support around $3. This company reported recently good EPS and revenue numbers. Both Records - 2019 Net Income of $3.5 Million and Net Sales of $42.3 Million. Its a Coronavirus play. They sells "Performacide" an EPA-registered disinfectant and sanitizer that is proven to kill previously known strands of human Coronavirus, and meets EPA criteria for use against the new, SARS-CoV-2, the cause of COVID-19. They reported an expansion of Production Capacity for Performacide last month. Chart shows a stock under accumulation. If the stock can take out the $4.5 level, the measured move of this pattern is $6+

( click to enlarge )

Ritter Pharmaceuticals Inc (NASDAQ:RTTR) is starting to turn back up and hourly indicators are giving the first bullish signs. On Friday it closed just slightly below its 50-hourly EMA, which if broken could accelerate the stock toward its June highs around the 50c area. Plus, the stock also closed abv the upper line of the descending channel. A volatility squeeze seems eminent. You want to watch the stock closely as RTTR can move quickly and you want to be ready for this move once it happens. As you know, timing is everything with these types of monster plays.

( click to enlarge )

Bio-Path Holdings Inc (NASDAQ:BPTH) has been in a nice uptrend over the past 2 weeks and volume appears to be picking up as well. For investors who are interested in this stock could watch for the breakout at $5.50 since the breach of this critical resistance is a sign of reversal from a down trend. Currently prices are supported by the rising short-term Hourly EMAs and the uptrend. The stock has plenty of room to run.

( click to enlarge )

Walmart (NYSE:WMT) broke out of a small consolidation pattern on high volume on the hourly chart and could eventually rally up to test its recent high around $126. Looking at the technical chart the near-term outlook is positive. The Relative Strength Index is moving higher, which is a sign of growing strength in the stock and MACD is also giving a positive indication. Long setup on watch.

( click to enlarge )

OPKO Health (NASDAQ:OPK) has achieved a boost during Friday’s market as traders witnessed the oversold position, driving shares up 0.87%. I would like to see a break over yesterdays high of 1.29 to indicate possible bounce is on deck. I feel that fundamentally, the stock looks attractive at least for the short term. I would like to point out that CEO is buying shares like crazy now on a daily basis. Generally when insiders buy shares, especially in large amount like we have been seen it is a sign that positive things are coming. Im long.

( click to enlarge )

Aikido Pharma Inc (NASDAQ:AIKI) is showing signs of bottoming out on the charts along with the MACD giving positive signals and CMF is showing positive buying pressure. Significant jump above 61c can take the stock northwards to 80c or even to 1 

( click to enlarge )

As I have been mentioned in a few tweets over the past couple of days, I keep holding my long position in MARK waiting for something BIG. The stock seems to be forming a bullish flag formation on the technical chart and is on the cusp of a move higher that could take it to the 60c area pretty easily.

Based on my experience over the years, here are some basic trading rules that should be taken always in consideration for trading in order to become a successful trader in the stock market. 

1 - The trend is your friend, so never go against the trend. 
2 - Keep your losses small. Golden rule: Cut losses short. Let profits run. 
3 - Use stops. The stop loss should be placed few cents below the supports and not at the same level (i dont use SLs for low float or penny stocks). 
4 - Learn the basics of fundamentals, charts and technical indicators. 
5 - The good trader is one who makes consistent gains, so don’t be a greedy trader, appreciate the small and the big gains. 
6 - Do not fear the market. Be always confident in your trade decisions. 
7 - Never buy what you do not want, because you think it is cheap. 
8 - Always be conscious that the loss may arise and you should be prepared for that to happen. Open mind. 
9 - For large positions, you must to have total control of the market never losing sight 
10 -Volume is a leading indicator, so play the breakouts using the volume as support of your decision. 
11 - Chart breaks without volume could be a trap and the probabilities of succeeding are low 
12 - Do not be hasty to buy or sell a stock, every day there are new opportunities to make money. Be patient is the key of success of any trader. 
13 - Only believe fundamentals as long as the technical signals follow. 
14 - Trading very speculative stocks is a frequent mistake. 
15 - Do not trade positions too large relative to your available capital. 
16 - Do not invest all your money in one company. Your portfolio must be diversified. 
17 - The Greed to pick tops or bottoms is a usual error. Wait for the perfect and confirmed signal. 
18 - Do not make trading decisions based on a story you saw in the morning paper. The market many times has already discounted the information. 
19 - Review your missteps to improve your skills 

With patience and discipline, you can take much more from the stock market than you ever gave. Trading stocks is not easy for beginners or professionals, it is really very hard and requires lot of attention and knowledge. If stock trading was easy, everyone would be doing it. You can be successful at the stock market, with patience, discipline and a good trade set-up. The key objective is to make money and not lose it.

Good FREE Sources of information to learn about trading (Google it) Investopedia, FDA Calendar, Secform4, Finzv, Stockcharts, Shortsqueeze, Benzinga, Stocktwits, Openinsider, Shortvolume, Fintel.
 
During the day I tweet many times to my readers. I encourage everybody to subscribe AC Investor Blog twitter and newsletter, so you can receive my trade ideas and stock news in real time.

Disclaimer : This is not an investment advisory, and should not be used to make investment decisions. Information in AC Investor Blog is often opinionated and should be considered for information purposes only. No stock exchange anywhere has approved or disapproved of the information contained herein. There is no express or implied solicitation to buy or sell securities. The charts provided here are not meant for investment purposes and only serve as technical examples. Don't consider buying or selling any stock without conducting your own due diligence.

Thanks for visiting AC Investor Blog.

AC

Labels: , , , , , , ,

Bookmark and Share

Saturday, February 01, 2020 

Stocks to watch for the coming week, including coronavirus plays

( click to enlarge )

Co-Diagnostics, Inc. (CODX) surged 20.7% or 56 cents to $3.26 after the company announced yesterday the successful initial verification of its screening test designed to identify the presence of the novel coronavirus and the test will soon be ready for validation in and subsequent distribution to any appropriate venue across the globe. The technical indicators still indicate a bullish tone in short-term. The major support level is located at $2.6 and the resistance is still at $3.60 Above this key level, stock has resistances at 3.77 (January 2019 high) followed by 6.66 (2018 Highs).

( click to enlarge )

BOQI International Medical Inc (NASDAQ:BIMI) finally broke the trading range it had been into from many weeks on the upside and managed to closed above it which is a positive sign for stock. The next major resistance stays at $5.70 Daily technical indicators are turning bullish. MACD is rising above its signal line in positive territory and RSI has reached its overbought zone. Buyable on a pullback ot its pivot zone.

( click to enlarge )

ShiftPixy Inc (NASDAQ:PIXY) Do you remember this stock? The same i mentioned (Stocks to Watch for December 19, 2019) as a potential bottom play few days before the big run to $27.5 now what? The stock is back to its prior levels and i started buying again. The bounce off the recent sell-off lows $7.50 could potentially be the start of an even higher move. I think this bodes well for another big bounce from current levels. First target $12

( click to enlarge )

CounterPath, Corp. (NASDAQ:CPAH) nice pullback on very low volume yesterday while MACD continues displaying a positive divergence. Added some for next leg up. Keep in mind, The company has partnered recently with Honeywell to create Smart Talk (the software solution enables workers to improve collaboration in several places including Hospitals). With more countries suspending travel to and from China due to the coronavirus problem, these stocks should be definitely in your radar screen next week. With nearly 20 years of experience, CounterPath is an industry leader in VoIP applications and has more than 20 million activations worldwide. From a technical standpoint, daily technical indicators have corrected oversold conditions, and are turning bullish now displaying positive divergences. With almost 15% of the float short, positive divergences, a basing chart pattern and a potential hot sector, these are the ingredients for a short squeeze.

( click to enlarge )

Novavax, Inc. (NASDAQ:NVAX) is getting ready for a breakout of the upper line of the large bull flag. Buy point would be on the day it blows through $8 on heavy volume.

( click to enlarge )

Cleveland BioLabs, Inc. (NASDAQ:CBLI) rallied hard Friday on heavy volume. If it clears back over 4.65, may have some good upside. SL 3.32

( click to enlarge )

Seneca Biopharma Inc (NASDAQ:SNCA) I have been following this stock for a few days now and surprisingly it showed some strength yesterday on volume in a depressed market. On the momentum front I'm seeing some positive divergences in several key momentum indicators, but this are not confirmed yet, as prices have not shown a confirmed reversal. Momentum oscillators are neutral to positive. The stock needs to break Friday’s high of $1.22 to expect a strong rally at this point. This stock was trading over $4 a share two weeks ago. Im long.

( click to enlarge )

Genprex Inc (NASDAQ:GNPX) is starting to make a move to break through the top of its range. This is a good stock to watch and once it breaks through $2 on a close basis the stock should move.

( click to enlarge )

Give Microbot Medical Inc (NASDAQ:MBOT) a close watch for a big bounce. Notice how the MACD on daily chart is starting to curl up, the grey histogram bars are starting to turn back to zero, showing that the recent downtrend is changing in the opposite direction. Plus, the stock has reached a major support level, where it bottomed out several times before. This low float could see a big bounce in the coming sessions.

( click to enlarge )

Ibio Inc (NYSEAMERICAN:IBIO) wait for the break of the box. An upside break of the trading range would signal a continuation of the rally from the November lows. Breakout watch over 34c

During the day I tweet many times to my readers. I encourage everybody to subscribe AC Investor Blog twitter and newsletter, so you can receive my trade ideas and stock news in real time.

Disclaimer : This is not an investment advisory, and should not be used to make investment decisions. Information in AC Investor Blog is often opinionated and should be considered for information purposes only. No stock exchange anywhere has approved or disapproved of the information contained herein. There is no express or implied solicitation to buy or sell securities. The charts provided here are not meant for investment purposes and only serve as technical examples. Don't consider buying or selling any stock without conducting your own due diligence.

Thanks for visiting AC Investor Blog.

AC

Labels: , , , , , , , , ,

Bookmark and Share

Saturday, May 11, 2019 

Interesting setups that you should watch next week

( click to enlarge )

Overstock com (NASDAQ:OSTK) broke the downtrend line with a nice volume and 9 &13 EMA to the upside and as long as $13 level holds we see upside continuation. Yesterday, bulliish candle on a read market confirms the strength of bulls and it gives us a buyl opportunity. MACD and RSI also confirms the price reversal. Next major resistance lies at 15.61 (EMA50)

( click to enlarge )

Co-Diagnostics Inc (NASDAQ: CODX) The price broke the downtrend line and moved above the short-term EMAs. It gives us a signal that the stock becomes bullish and we have to search for buy opportunities. The bullish divergence on indicators also tells us about possible trend reversal. DMI is turning positive just as MACD has already done. It appears a reversal to the upside is underway. This stock should be able to rally into the gap zone. I entered long last week.

( click to enlarge )

Biopharmx Corp (NYSEAMERICAN: BPMX) is still in bottoming mode it looks like. The technical indicators are looking better now for the stock. The daily MACD is starting to rise, confirming a bullish divergence has taken form. As I mentioned earlier on twiiter, BPMX has had days when it exploded out-of-the-gates and made tremendous gains. We know that past performance is not always a guarantee of future performance, but we could learn from how BPMX has reacted in the past when it reaches extreme oversold conditions and in the past this stock has made double-digit moves upwards within one day. The stock has the potential to make a big run next week, so keep a close eye on it and don’t miss the trade. As i tweeted, im long.

( click to enlarge )

Marathon Patent Group Inc (NASDAQ: MARA) had a great move on the upside Friday, fueled by the strength of Bitcoin and closed at $2.92. The stock is setting up to break out and has one more level to go, which is $3.05

( click to enlarge )

Cool Holdings Inc (NASDAQ: AWSM) broke out from a falling wedge pattern accompanied with high volume. We should be able to see some decent upside movement for the bulls here. A positive MACD cross has occurred and RSI is moving up strongly. Next immediate resistance lies at 3.66 (EMA200).

( click to enlarge )

Village Farms International Inc (NASDAQ: VFF) price broke a consolidation resistance line with heavy volume. The technical daily chart shows buyers are back. With the surge this week %K line is again on top over %D line showing the stock is back to new rally. Also +DI crossed above -DI. A move towards $14 can be expected as long as $11 holds.

( click to enlarge )

Mustang Bio Inc (NASDAQ: MBIO) wants to break out and move higher. If we close above 4.5, we can run to 5 easily.

( click to enlarge )

Workhorse Group Inc (NASDAQ: WKHS) I think stock should pullback to $1.73 per share before making the next move. If support holds, then it'll advance again to a new high, but if support fails, then the next level of support is at $1.57. Any fall below this level will ring my alarm bells and would signal a definite reversal.

( click to enlarge )

Uber (NYSE: UBER) The first IPO day was a huge disappoint as expected. Stock needs to hold the $41 in order to avoid another sell-off.

During the day I tweet many times to my readers. I encourage everybody to subscribe AC Investor Blog twitter and newsletter, so you can receive my trade ideas and stock news in real time.

Disclaimer : This is not an investment advisory, and should not be used to make investment decisions. Information in AC Investor Blog is often opinionated and should be considered for information purposes only. No stock exchange anywhere has approved or disapproved of the information contained herein. There is no express or implied solicitation to buy or sell securities. The charts provided here are not meant for investment purposes and only serve as technical examples. Don't consider buying or selling any stock without conducting your own due diligence.

Thanks for visiting AC Investor Blog.

AC

Labels: , , , , , , , ,

Bookmark and Share

Saturday, July 07, 2018 

Top Trade Ideas for next week

( click to enlarge )

Unisys Corporation (NYSE:UIS) broke its major resistance yesterday on heavy volume and continues to work its way higher. From the technical daily chart both KD and MACD are showing bullish sign as KD is rising while MACD is crossing up. Investors should consider buying any pullback moving forward with a stop around its rising 50-DAY ema.

( click to enlarge )

Twitter Inc (NYSE: TWTR) which has been building momentum since the beginning of June, broke out of its bullish flag/consolidation on Friday. The stock is now positioned for a move to new highs if the broader sector holds up.

( click to enlarge )

Bilibili Inc (NASDAQ: BILI) bounced nicely yesterday from the bottom of their possible falling wedge pattern. A break and close above the 13.50 level next week could move the stock significantly higher as it attempts to break out of this pattern in place since mid-June highs. On watch.

( click to enlarge )

ArQule, Inc. (NASDAQ: ARQL) traced out a nice setup and the upside breakout has a lot of power IMHO. Volume surged and this breakout looks like it is here to stay. There looks to be good upside in ARQL, so keep it on your radar the next few days.

( click to enlarge )

Bridgeline Digital Inc (NASDAQ: BLIN) broke out Friday and traded nearly 3x normal daily volume. The stock has the potential to make a big run on Monday, so keep a close eye on BLIN and don’t miss the trade.

( click to enlarge )

Co-Diagnostics Inc (NASDAQ: CODX) caught my attention on Friday. The signal to buy was given today when the $4 level was taken out. This breakout suggests a possible move to $4.75 initialy. Long setup on watch.

( click to enlarge )

Black Box Corporation (NASDAQ: BBOX) has already recouped its recent losses and looks poised to break resistance at $2.30. The near-term outlook stays cautious till the stock closes conclusively above this level. Short-term traders can hold their longs with a stop at $1.8

( click to enlarge )

Achieve Life Sciences Inc (NASDAQ: ACHV) is back at the bottom area and could provide another great swing trade. I bought shares on Friday. Stop loss is a close below 3.28 and im looking for a move up to 4.2 at least.

( click to enlarge )

Ekso Bionics Holdings Inc (NASDAQ: EKSO) looks like is close to attempting another breakout. This strength is confirmed by price movement as well as two key momentum indicators. MACD and RSI show buy signal as MACD is above signal line and RSI above its 50% level. I think the market is waiting for fresh news (new contracts with OEMs) to define the trend, however if the stock breaks above $2.2, then that is a bullish sign as higher prices.

( click to enlarge )

VirnetX Holding Corporation (NYSEAMERICAN: VHC) can pop big time on any positive news. After a big price-volume (V-bounce) surge in May, the stock has consolidated in the last two months in the 3/3.6 trading range, which looks like it's ready to be broken. The consolidation and compression that has been going on in the last weeks is very healthy. The technical daily chart still showing a bullish bias. If a breakout occurs I expect to see the stock in the 4.3/4.5 range short-term.

During the day I tweet many times to my readers. I encourage everybody to subscribe AC Investor Blog twitter and newsletter, so you can receive my trade ideas and stock news in real time.

Disclaimer : This is not an investment advisory, and should not be used to make investment decisions. Information in AC Investor Blog is often opinionated and should be considered for information purposes only. No stock exchange anywhere has approved or disapproved of the information contained herein. There is no express or implied solicitation to buy or sell securities. The charts provided here are not meant for investment purposes and only serve as technical examples. Don't consider buying or selling any stock without conducting your own due diligence.

Thanks for visiting AC Investor Blog.

AC

Labels: , , , , , , , , ,

Bookmark and Share
Contact

About Me

    Photobucket
  • I'm a 48 year old Independent Trader using proprietary technical analysis with more than 20 years experience of investing in the US stock markets. I started this blog in 2006 simply as a way to share my thoughts about capital, risk management, and trading. My blog contains only my personal opinion and is provided for informational purposes only.

  • Benzinga.com supporter

    Benzinga.com supporter


    FREE NEWSLETTER

      Enter your email address:

      Delivered by FeedBurner

      Subscribe my feed :

    Support AC

    • Support AC Investor Blog, Donate with PayPal

    Advertising

      Interested in advertising on AC Investor Blog ? Click Here

    TRANSLATOR

    Site Information

    Stock Market Blogroll

    Friends BLOGROLL

    ARCHIVES

Powered by Blogger
and Blogger Templates


Add to Google