-Financial Tools Futures Market--TRADE IDEAS-- OPTION ALERTS -BENZINGA PRO-

Saturday, September 19, 2020 

Swing Trading Setups to Watch Next Week

( click to enlarge )

I think  Happiness Biotech Group Ltd (NASDAQ:HAPP) has found support around the $1.90-$2.05 range and looks poised to post a bounce from here. I could see a 25-35% possible bounce up to $2.6 - $2.8 a share if we can get past the resistance point at 2.19 There are several daily technical indications I see which suggest a bottom, including large positive divergences on MACD and ADX on daily. If the potential buy signal confirms itself, we will be looking for a move to the resistance area at $2.6, at the very least. Keep it on your watch list going forward. Could be a high flyer on breakout. NOTE: On June 5, the Company successfully obtained the CE certification for COVID-19 anti-body testing kits. The company provides disinfectants, non-medical face masks, and COVID-19 anti-body testing kits.

( click to enlarge )

Kandi Technologies Group Inc (NASDAQ:KNDI) price had a nice surge a few weeks ago and has been in a correction mode since then, finding a strong around the $6 level. The stock is now displaying upside momentum again and is poised to move higher from these levels. Nearest resistance for the stock is at $6.73. If this level is crossed and the stock is able to sustain above this level, then it might go to $10. From a technical standpoint, the MACD is slowly turning up forming a buy signal and RSI is also showing signs of reversal. With Tesla battery day coming up, this stock must be on your radar next week.

( click to enlarge )

Remark Holdings Inc (NASDAQ:MARK) showed buying strength all day on Friday. We are finally starting to see some signals of rebound as the daily technical chart shows positive momentum is back. If stock breaks 1.38 then the stock can head to 1.98 and if this level is breached then the level of 2.5 is visible. I think it's worth adding to your watchlist.

( click to enlarge )

Seanergy Maritime Holdings Corp. (NASDAQ:SHIP) looks like a bottom formation here. A breakout over 56c with strong volume would send this flying. I went long on Friday following Reuters news "Baltic index posts weekly gain on robust capesize rates". I see a 70c move coming.

( click to enlarge )

Onconova Therapeutics Inc (NASDAQ:ONTX) made an awesome move breaking out of a major resistance line with volume backed confirmation on Friday. Should breakout hard to upside when it crosses over 40c Definitely on watch next week.

( click to enlarge )

Pacific Ethanol Inc (NASDAQ:PEIX) Continues to act strong setting new highs. Pullbacks to the rising 9EMA (yellow line) are buying opportunities. The upside is favored as long as this line holds.

( click to enlarge )

News Corp Class A (NASDAQ:NWSA) broke out to new highs on high volume. The uptrend remains intact and signals further bullishness on this stock. Technical indicators are bullish.

( click to enlarge )

Bio-Path Holdings Inc (NASDAQ:BPTH) saw its shares surged almost 4.5% to $4.44 per share on decent volume Friday after received a Notice of Allowance for its US patent application 16/426,798 titled "P-ETHOXY NUCLEIC ACIDS FOR LIPOSOMAL FORMULATION. On the daily chart, the stock has a strong resistance around $5.65, and a break above it should lead to a continued advance up to 7, the next strong resistance level. I like the stock at current levels.

( click to enlarge )

Retractable Technologies, Inc. (NYSEAMERICAN:RVP) appears to have successfully reversed its downtrend. The stock has some noticeable indicators suggesting that it is ready to make a move. Buyable on any pullback to pivot. Long setup.
( click to enlarge )

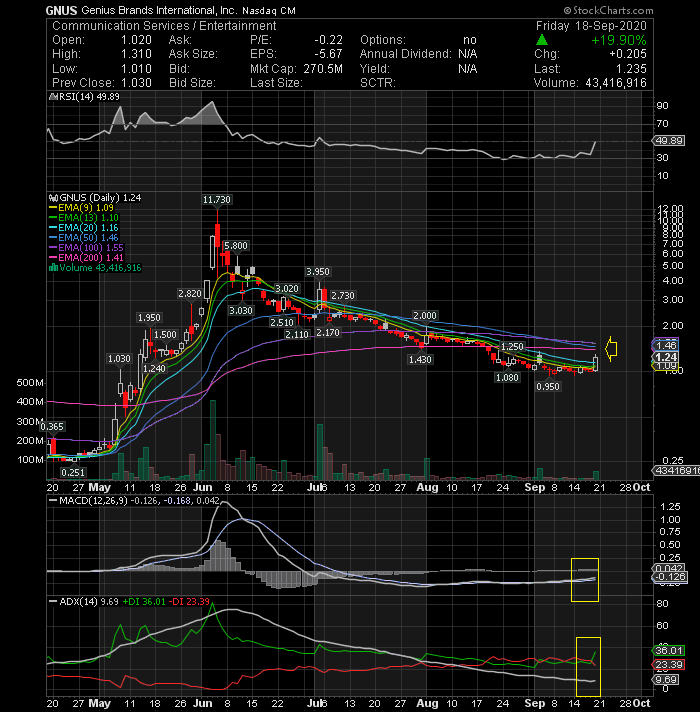
Genius Brands International Inc (NASDAQ:GNUS) is another stock I am watching closely. If it clears resistance at $1.41 (EMA200), the move may be powerful. The trend indicator MACD has triggered a new buy signal and also the RSI is on the positive side again. GNUS will move quickly, so keep it on your screen next week.

( click to enlarge )

Spartan Energy Acquisition Ord Shs Class A (NYSE:SPAQ) has been stuck in a range between $16 and $18 for much the last five sessions (healthy consolidation), waiting for some news to support the next movement on either way. Anyway, a short/medium-term bullish bias is favoured as long as the key support around 15.45 holds.

( click to enlarge )

Kodak (NYSE:KODK) had another big pop yesterday and the stock price finally closed above the $12 resistance level. Go long on the break of Friday’s high at 12.51 with a SL 10.82 Strong bullish volume on chart.

During the day I tweet many times to my readers. I encourage everybody to subscribe AC Investor Blog twitter and newsletter, so you can receive my trade ideas and stock news in real time.

Disclaimer : This is not an investment advisory, and should not be used to make investment decisions. Information in AC Investor Blog is often opinionated and should be considered for information purposes only. No stock exchange anywhere has approved or disapproved of the information contained herein. There is no express or implied solicitation to buy or sell securities. The charts provided here are not meant for investment purposes and only serve as technical examples. Don't consider buying or selling any stock without conducting your own due diligence.

Thanks for visiting AC Investor Blog.

AC

Labels: , , , , , , , , , ,

Bookmark and Share

Sunday, July 19, 2020 

Potential swing trade ideas for the week ahead

( click to enlarge )

This stock is lining up for a serious bull run and it has the potential to become one of the most explosive breakout play opportunities of the month. I continue to support the idea of a significant rally on shares of  Arca Biopharma Inc (NASDAQ: ABIO), probably even above the June highs. We still need to see a break and close above 7.80 to confirm a continuation to the upside with a next target in the 10 area. Due to its low float a parabolic move is also not out of the question. Daily technical indicators are beginning to turn bullish. MACD is about to cross the signal line, which indicates that the bulls are trying to take over and RSI has moved above its 50% level. There looks to be good upside potential, so watch the stock very closely next week.

( click to enlarge )

Ideanomics Inc (NASDAQ:IDEX) is showing signs of a potential upside recovery. MACD has stabilized and is crossing over its signal line. The August $1 call options have been very active. Next week watch the resistance at 1.43. A close above will be bullish and may test 1.76/2.0

( click to enlarge )

BioNTech SE (NASDAQ:BNTX) Flagging here. The buy/add point would be when it breaks over 87.58 on volume.

( click to enlarge )

Arcadia Biosciences Inc (NASDAQ:RKDA) displayed relative strength on Friday and broke out above resistance at the $3.75 level on solid volume. The 4h 20EMA has been a strong resistance for days. Watching if this can go into $4.5's next week.

( click to enlarge )

Nio Inc (NYSE:NIO) After a great run in the first half of July, the stock has been in a correction mode. $10.46 is strong short-term support. If the stock holds the support then expect a good rally towards the level of $12 and then $12.45. On the 30m chart the MACD triggered a new buy signal as the momentum indicator crossed above its signal line. On the other hand, if the stock breaks the support on volume, it can go down again to 9.5 (closing gap). Definitely on watch next week.

( click to enlarge )

I feel Sundance Energy Inc (NASDAQ:SNDE) is on the verge of a big bounce from these cheap levels. The stock has formed a large falling wedge in the last few weeks and is showing signs of bullishness. I would look for a move up to $3.25 in the coming sessions. If it passes that, there is very strong resistance at $4 coming up next.

( click to enlarge )

Hepion Pharmaceuticals Inc (NASDAQ:HEPA) closed up 10% on Friday and strong momentum appears to be building rapidly. The stock price broke out of a base formation on decent volume and could eventually rally up to test the 4.80 resistance zone again. HEPA has seen huge gains over short periods in the past and I believe this breakout could trigger another bull run. From a technical standpoint, the positive momentum seems to be back as the stock is back above the major medium-term EMAs with the RSI going up and MACD in the positive territory.

( click to enlarge )

FORESIGHT AUTON/S (NASDAQ:FRSX) is forming a large ascending triangle formation on the daily chart, which is usually bullish and could end up in a price spike on the break.

( click to enlarge )

SPARTAN ENERGY /SH (NYSE:SPAQ) has found a bottom here and looks poised to post a rally from current levels. We start to see some signals of rebound as the technical chart shows positive momentum is back. If stock breaks 15.81 then the stock can head to 18 and if this level is breached then the level of 21.5 is visible. Long setup on watch.

( click to enlarge )

Urban One Inc Class D (NASDAQ:UONEK) Still on TOP of my watchlist. Key resistance is located at $1.78, a break above this level will confirm a new bullish trend and the following uptrend will take the price up to the $2.5 zone. The MACD is turning up, which is a sign of growing strength in the stock. I think it's worth adding to your watchlist.

( click to enlarge )

JAKKS Pacific, Inc. (NASDAQ:JAKK) well-positioned as a bottom bounce play at 5.90 a share. I know that it is too early to say for certain but looking at the chart above is very likely. The stock took a big drop in just a few weeks, and is presently trading at levels very low. It's hard to believe, but the share price is now 50% cheaper than was in June and trading in oversold conditions. If it starts to move above $6 with strong volume, that will be an indication of a bounce. Keep JAKK in your watchlist.

During the day I tweet many times to my readers. I encourage everybody to subscribe AC Investor Blog twitter and newsletter, so you can receive my trade ideas and stock news in real time.

Disclaimer : This is not an investment advisory, and should not be used to make investment decisions. Information in AC Investor Blog is often opinionated and should be considered for information purposes only. No stock exchange anywhere has approved or disapproved of the information contained herein. There is no express or implied solicitation to buy or sell securities. The charts provided here are not meant for investment purposes and only serve as technical examples. Don't consider buying or selling any stock without conducting your own due diligence.

Thanks for visiting AC Investor Blog.

AC

Labels: , , , , , , , , , ,

Bookmark and Share
Contact

About Me

    Photobucket
  • I'm a 48 year old Independent Trader using proprietary technical analysis with more than 20 years experience of investing in the US stock markets. I started this blog in 2006 simply as a way to share my thoughts about capital, risk management, and trading. My blog contains only my personal opinion and is provided for informational purposes only.

  • Benzinga.com supporter

    Benzinga.com supporter


    FREE NEWSLETTER

      Enter your email address:

      Delivered by FeedBurner

      Subscribe my feed :

    Support AC

    • Support AC Investor Blog, Donate with PayPal

    Advertising

      Interested in advertising on AC Investor Blog ? Click Here

    TRANSLATOR

    Site Information

    Stock Market Blogroll

    Friends BLOGROLL

    ARCHIVES

Powered by Blogger
and Blogger Templates


Add to Google


