-Financial Tools Futures Market--TRADE IDEAS-- OPTION ALERTS -BENZINGA PRO-

Saturday, September 19, 2020 

Swing Trading Setups to Watch Next Week

( click to enlarge )

I think  Happiness Biotech Group Ltd (NASDAQ:HAPP) has found support around the $1.90-$2.05 range and looks poised to post a bounce from here. I could see a 25-35% possible bounce up to $2.6 - $2.8 a share if we can get past the resistance point at 2.19 There are several daily technical indications I see which suggest a bottom, including large positive divergences on MACD and ADX on daily. If the potential buy signal confirms itself, we will be looking for a move to the resistance area at $2.6, at the very least. Keep it on your watch list going forward. Could be a high flyer on breakout. NOTE: On June 5, the Company successfully obtained the CE certification for COVID-19 anti-body testing kits. The company provides disinfectants, non-medical face masks, and COVID-19 anti-body testing kits.

( click to enlarge )

Kandi Technologies Group Inc (NASDAQ:KNDI) price had a nice surge a few weeks ago and has been in a correction mode since then, finding a strong around the $6 level. The stock is now displaying upside momentum again and is poised to move higher from these levels. Nearest resistance for the stock is at $6.73. If this level is crossed and the stock is able to sustain above this level, then it might go to $10. From a technical standpoint, the MACD is slowly turning up forming a buy signal and RSI is also showing signs of reversal. With Tesla battery day coming up, this stock must be on your radar next week.

( click to enlarge )

Remark Holdings Inc (NASDAQ:MARK) showed buying strength all day on Friday. We are finally starting to see some signals of rebound as the daily technical chart shows positive momentum is back. If stock breaks 1.38 then the stock can head to 1.98 and if this level is breached then the level of 2.5 is visible. I think it's worth adding to your watchlist.

( click to enlarge )

Seanergy Maritime Holdings Corp. (NASDAQ:SHIP) looks like a bottom formation here. A breakout over 56c with strong volume would send this flying. I went long on Friday following Reuters news "Baltic index posts weekly gain on robust capesize rates". I see a 70c move coming.

( click to enlarge )

Onconova Therapeutics Inc (NASDAQ:ONTX) made an awesome move breaking out of a major resistance line with volume backed confirmation on Friday. Should breakout hard to upside when it crosses over 40c Definitely on watch next week.

( click to enlarge )

Pacific Ethanol Inc (NASDAQ:PEIX) Continues to act strong setting new highs. Pullbacks to the rising 9EMA (yellow line) are buying opportunities. The upside is favored as long as this line holds.

( click to enlarge )

News Corp Class A (NASDAQ:NWSA) broke out to new highs on high volume. The uptrend remains intact and signals further bullishness on this stock. Technical indicators are bullish.

( click to enlarge )

Bio-Path Holdings Inc (NASDAQ:BPTH) saw its shares surged almost 4.5% to $4.44 per share on decent volume Friday after received a Notice of Allowance for its US patent application 16/426,798 titled "P-ETHOXY NUCLEIC ACIDS FOR LIPOSOMAL FORMULATION. On the daily chart, the stock has a strong resistance around $5.65, and a break above it should lead to a continued advance up to 7, the next strong resistance level. I like the stock at current levels.

( click to enlarge )

Retractable Technologies, Inc. (NYSEAMERICAN:RVP) appears to have successfully reversed its downtrend. The stock has some noticeable indicators suggesting that it is ready to make a move. Buyable on any pullback to pivot. Long setup.
( click to enlarge )

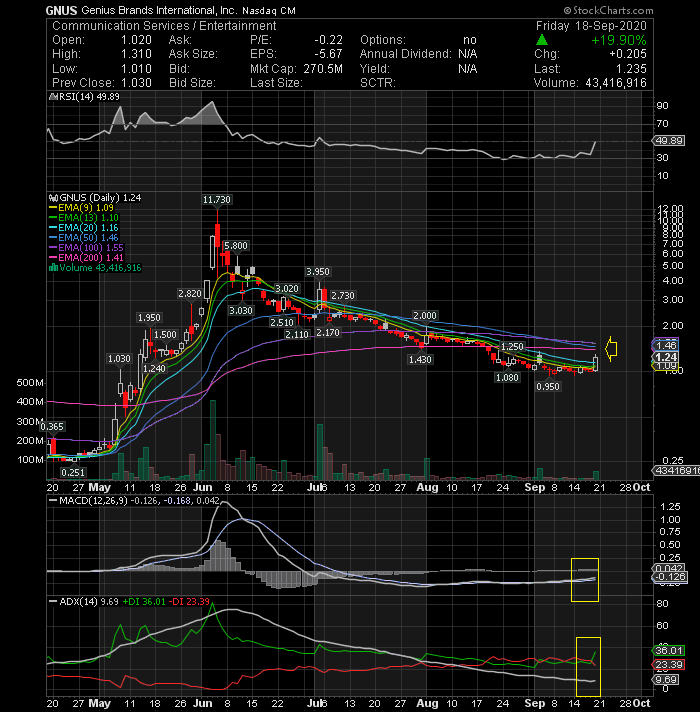
Genius Brands International Inc (NASDAQ:GNUS) is another stock I am watching closely. If it clears resistance at $1.41 (EMA200), the move may be powerful. The trend indicator MACD has triggered a new buy signal and also the RSI is on the positive side again. GNUS will move quickly, so keep it on your screen next week.

( click to enlarge )

Spartan Energy Acquisition Ord Shs Class A (NYSE:SPAQ) has been stuck in a range between $16 and $18 for much the last five sessions (healthy consolidation), waiting for some news to support the next movement on either way. Anyway, a short/medium-term bullish bias is favoured as long as the key support around 15.45 holds.

( click to enlarge )

Kodak (NYSE:KODK) had another big pop yesterday and the stock price finally closed above the $12 resistance level. Go long on the break of Friday’s high at 12.51 with a SL 10.82 Strong bullish volume on chart.

During the day I tweet many times to my readers. I encourage everybody to subscribe AC Investor Blog twitter and newsletter, so you can receive my trade ideas and stock news in real time.

Disclaimer : This is not an investment advisory, and should not be used to make investment decisions. Information in AC Investor Blog is often opinionated and should be considered for information purposes only. No stock exchange anywhere has approved or disapproved of the information contained herein. There is no express or implied solicitation to buy or sell securities. The charts provided here are not meant for investment purposes and only serve as technical examples. Don't consider buying or selling any stock without conducting your own due diligence.

Thanks for visiting AC Investor Blog.

AC

Labels: , , , , , , , , , ,

Bookmark and Share

Sunday, September 08, 2019 

Trade Ideas for the coming week

( click to enlarge )

Snap Inc. (NYSE: SNAP) broke out of a bullish flag formation and closed just slightly below a key resistance level at $17. A break of this level in the next couple of days could lead the stock towards new highs around the 18.36 area. Long setup.

( click to enlarge )

Kandi Technologies Group Inc (NASDAQ: KNDI) jumped 12 cents, or 2.26%, on Friday, breaking key resistance at 5.38 and closing at 5.44. That's the highest close in more than six weeks, thus confirming that the stock has renewed momentum. This momentum could move stock to the 5.8 area in the next few trading days. Long setup on watch.

( click to enlarge )

I like this daily chart on Twitter, Inc. (NYSE: TWTR) a lot. Prob one of my Favorites. As you can see the stock brokeout on high volume Thursday and was able to keep the strength on Friday. I've seen this many times in the market and you know what the end result usually is? Well, it's alot of money. RSI still rising and we are not even in overbought territory yet. Plus, the Accumulation/Distribution shows that the stock continues to be under accumulation by institutional traders and money managers. We should see more highs ahead.

( click to enlarge )

Inpixon (NASDAQ:INPX) was able to make upward movements in intraday trading for the second day in a row as volume continues to increase. In the past, INPX has been able to significantly witness growth in market valuation following the type of trading activity that has been seen recently. Breakout watch over 0.142 on volume for a possible short-term target of 18c (Note: This is a penny stock, so play accordingly).

( click to enlarge )

Appliance Recycling Cntrs of Amer Inc (NASDAQ: ARCI) has been consolidating around 4.50 levels. We have seen strong accumulation during the consolidation phase, very positive sign. Watch for a potential breakout next week since volume is expected to increase under conditions showing light resistance. Daily technical indicators are looking bullish. MACD is lying above the Power Zone and RSI is about 54 so it's in the range of its support prices which could minimize the downside risk at these levels. Worth watching for a breakout above the 4.85 level.

( click to enlarge )

Zosano Pharma Corp (NASDAQ: ZSAN) broke and closed back above its hourly 50EMA on solid volume. The bulls will now try and regain control. Watch the stock next week since shares appears setup for an Increase.

( click to enlarge )

Roku (NASDAQ:ROKU) Big momo stock. Consolidating here, play the line it breaks on heavy volume.

( click to enlarge )

Baxter International Inc. (NYSE:BAX) Cleared this ascending triangle on volume. Setting up for higher prices.

( click to enlarge )

I alerted  Microbot Medical Inc (NASDAQ:MBOT) to my twitter followers a few days ago before crowd when it was trading around the $5 level. The stock jumped 44% or $2.16 cents to 7.06 on Friday as the company announced that will demonstrate a working prototype of the Company’s Self-Cleaning Shunt (SCS™). I still holding a small position. Next major resistance lies at 7.5 

During the day I tweet many times to my readers. I encourage everybody to subscribe AC Investor Blog twitter and newsletter, so you can receive my trade ideas and stock news in real time.

Disclaimer : This is not an investment advisory, and should not be used to make investment decisions. Information in AC Investor Blog is often opinionated and should be considered for information purposes only. No stock exchange anywhere has approved or disapproved of the information contained herein. There is no express or implied solicitation to buy or sell securities. The charts provided here are not meant for investment purposes and only serve as technical examples. Don't consider buying or selling any stock without conducting your own due diligence.

Thanks for visiting AC Investor Blog.

AC

Labels: , , , , , , , ,

Bookmark and Share

Tuesday, April 12, 2016 

Stocks to Watch for April 13, 2016

( click to enlarge )

Seadrill Ltd (NYSE:SDRL) printed a strong bullish candle on Tuesday, showing huge buying pressure and the stock looks to be on the cusp of a big breakout to the upside. Some technical indicators are turning up here. Further strength above $4.02 opens the door to +$5.50. Put her on your radar.

( click to enlarge )

VirnetX Holding Corporation (NYSEMKT:VHC) has started to bounce and broke out of a descending channel formation today closing above resistance 4.50 level. The stock seems to be ready for another run up.

( click to enlarge )

Kandi Technologies Group Inc (NASDAQ:KNDI) is looking nice. Volume is picking up again. Next buy when clears 7.60 on volume.

( click to enlarge )

Itau Unibanco Holding SA (NYSE:ITUB) finally broke through resistance at 9.20 today. Looks good for higher prices. Stop 8.75

( click to enlarge )

Kellogg Company (NYSE:K) may be setting up to make new highs. Next buy area is when the stock clears 78.10 on heavy volume. Stop 73.96

( click to enlarge )

The Oil sector is on fire and Apache Corporation (NYSE:APA) is no exception. It has a strong chart.

If you want to contact me for advertising opportunities on blog or twitter, then get in touch via email

Disclaimer : This is not an investment advisory, and should not be used to make investment decisions. Information in AC Investor Blog is often opinionated and should be considered for information purposes only. No stock exchange anywhere has approved or disapproved of the information contained herein. There is no express or implied solicitation to buy or sell securities. The charts provided here are not meant for investment purposes and only serve as technical examples. Don't consider buying or selling any stock without conducting your own due diligence.

Thanks for visiting AC Investor Blog.

AC

Labels: , , , , ,

Bookmark and Share

Thursday, June 11, 2015 

Stocks to keep an eye on June 12, 2015

( click to enlarge )

XOMA Corp (NASDAQ:XOMA) As I've mentioned earlier the stock has shown increased trading activity in call options and some signs of being under accumulation. Options traders have been focused on call options again today. The price broke and closed above the 100-day EMA today pointing the way for further move up. Technical indicators such as ADX is confirming the upside movement and the volume was significantly higher compared with last nine days. Although the stock did not perform well this year, we start to see now signals of rebound as the daily technical chart shows.

( click to enlarge )

Genworth Financial Inc (NYSE:GNW) Setting up a possible resistance breakout trade. Long over 8.11. There are several indications on daily technical chart which suggest a near-term bottom.

( click to enlarge )

IsoRay, Inc. (NYSEMKT:ISR) Selling pressure is losing steam here. The stock has been beaten down since last month, but at this moment it seems pretty clear that buyers have been waiting in the 1.5-1.60 range. It looks like it is starting to turn back up and indicators are giving the first bullish signs. Breakout watch over 1.65

( click to enlarge )

Kandi Technologies Group Inc (NASDAQ:KNDI) formed a strong bullish candle in the daiy time frame and volume was above average, which is bullish. The daily technical chart also shows that stochastics are turning back up from an oversold condition. A close above the $10 level tomorrow will re-establish the short-term bullish posture of the stock with $10.50 as the next upside objective. On watch.

( click to enlarge )

Tarena International Inc (NASDAQ:TEDU) Will watch to see if it can break this horizontal resistance line. If it breaks, we could see 14.40 quickly.


Disclaimer : This is not an investment advisory, and should not be used to make investment decisions. Information in AC Investor Blog is often opinionated and should be considered for information purposes only. No stock exchange anywhere has approved or disapproved of the information contained herein. There is no express or implied solicitation to buy or sell securities. The charts provided here are not meant for investment purposes and only serve as technical examples. Don't consider buying or selling any stock without conducting your own due diligence.

Thanks for visiting AC Investor Blog.

AC

Labels: , , , ,

Bookmark and Share

Monday, March 16, 2015 

Stocks to keep an eye on March 17, 2015

( click to enlarge )

VIVUS, Inc. (NASDAQ:VVUS) made a significant move on Monday breaking out its major resistance line at $3 on high volume. This breakout suggests a possible move to $3.40 in short-term. The technical daily chart shows a bullish sign as the stock is back on top of its short-term EMAs. In addition, MACD is back above zero line and RSI is back above 50% level which show beginning of bull market rally.

( click to enlarge )

Tesla Motors Inc (NASDAQ:TSLA) closed higher today on decent volume as the stock is trying to make an upside move. It has had a hard time to close above the 20EMA. It would need to break and close above that level to run to $205.88 (50EMA).

( click to enlarge )

Kandi Technologies Group Inc (NASDAQ:KNDI) broke out of a one-month range, hitting a high of $14.85. The technicals point to a move higher in the coming days. The MACD indicator is above its signal line and is indicating further strength. In addition, the RSI indicator is moving up above 50% level and the +DI is greater than the -DI by a great margin, indicating a Bullish trend. I will be watching KNDI on Tuesday, looking for a follow through move.

( click to enlarge )

Take-Two Interactive Software, Inc. (NASDAQ:TTWO) is picking up momentum and could make a good upside soon. Although the stock did not perform well in February, I start to see some signals of rebound. The trend indicator MACD has triggered a new buy signal today and also the RSI is on the positive side again.

( click to enlarge )

Starbucks Corporation (NASDAQ:SBUX) looks to be setting up for an upside move. The stock needs to break the recent highs to expect a strong rally at this point.

( click to enlarge )

Shares of DexCom, Inc. (NASDAQ:DXCM) are starting to heat up again and are worth watching. If volume can pick up, I believe this stock can break through resistance at $64 and re-test its recent highs around $64.64.

Disclaimer : This is not an investment advisory, and should not be used to make investment decisions. Information in AC Investor Blog is often opinionated and should be considered for information purposes only. No stock exchange anywhere has approved or disapproved of the information contained herein. There is no express or implied solicitation to buy or sell securities. The charts provided here are not meant for investment purposes and only serve as technical examples. Don't consider buying or selling any stock without conducting your own due diligence.

Thanks for visiting AC Investor Blog.

AC

Labels: , , , , ,

Bookmark and Share

Monday, July 21, 2014 

Stocks to Watch for July 22, 2014

( click to enlarge )

Kandi Technologies Group Inc (NASDAQ:KNDI) continues to show strength as the stock closed up $1.98 on Monday. 22.40 looks to be the next break out area. As long as the stock holds gains above 20, the upside will remain under pressure. 

( click to enlarge )

The chart of Gulf Resources, Inc. (NASDAQ:GURE) caught my eye today. On the above technical chart, we can quickly see that the stock is forming a symmetrical triangle waiting to be broken. A breakout from the upper trend line of the triangle (2.15 levels) can trigger a sharp upside move towards 2.35. With MACD now above zero and A/D indicator showing steady accumulation, a major rally is probably coming.

( click to enlarge )

The money seems to be flowing into XG Technology Inc (NASDAQ:XGTI) as indicated by the OBV. With no resistance between $2.35 and $3, a break above the $2.39 level (Monday's high) can see the stock trade in the $3 area pretty soon. Have this on your watchlist.

( click to enlarge )

Alcoa Inc (NYSE:AA) still holding within the bull flag. A break above 16.71 on heavy volume would be the next buy point.

( click to enlarge )

Herbalife Ltd.(NYSE:HLF) Ugly technical chart. Next major supports are witnessing at 51.38 and 49.35.

During the day I tweet many times to my readers. I encourage everybody to subscribe AC Investor Blog twitter and newsletter, so you can receive my trade ideas and stock news in real time.

Disclaimer : This is not an investment advisory, and should not be used to make investment decisions. Information in AC Investor Blog is often opinionated and should be considered for information purposes only. No stock exchange anywhere has approved or disapproved of the information contained herein. There is no express or implied solicitation to buy or sell securities. The charts provided here are not meant for investment purposes and only serve as technical examples. Don't consider buying or selling any stock without conducting your own due diligence.

Thanks for visiting AC Investor Blog.

AC

Labels: , , , ,

Bookmark and Share

Monday, March 17, 2014 

Stocks to Watch for March 18, 2014

( click to enlarge )

Kandi Technologies Group Inc (NASDAQ:KNDI) broke out of the bull flag pattern to new highs today. The stock traded heavy volume as it hit a high of $22.11. This high is the next resistance for Tuesday’s continuation move.

( click to enlarge )

GasLog Ltd (NYSE:GLOG) looks strong enough to move forward. The stock bounced off support of the 9-day exp moving average and surged nearly 4.5% with good volume. It has the potential for a strong follow through, so watch it closely on Tuesday.

( click to enlarge )

Ventrus Biosciences Inc(NASDAQ:VTUS) Bulls are attacking the 9-day exp moving average located at 1.43, a break above could trigger a rally towards 1.50 resistance and determine overall bias.There are some signs that the stock is gaining some momentum in recent days. The stock is well oversold and a bull move is probable for the coming sessions. The technical chart shows some divergences on MACD and RSI. Keep an eye on VTUS and be prepared for this upcoming move.

( click to enlarge )

Idenix Pharmaceuticals Inc (NASDAQ:IDIX) looks to be setting up for a breakout move, which could occur very soon. The stock traded a good volume today as it closed up 27 cents on the day. It is trading near the major level of $7.50, which is resistance for a breakout move. I'm buyer once this move occurs and I expect to see strong volume drive the stock higher.

During the day I tweet many times to my readers. I encourage everybody to subscribe AC Investor Blog twitter and newsletter, so you can receive my trade ideas and stock news in real time.

Disclaimer : This is not an investment advisory, and should not be used to make investment decisions. Information in AC Investor Blog is often opinionated and should be considered for information purposes only. No stock exchange anywhere has approved or disapproved of the information contained herein. There is no express or implied solicitation to buy or sell securities. The charts provided here are not meant for investment purposes and only serve as technical examples. Don't consider buying or selling any stock without conducting your own due diligence.

Thanks for visiting AC Investor Blog.

AC

Labels: , , ,

Bookmark and Share

Saturday, December 28, 2013 

Stocks to Watch for December 30, 2013

( click to enlarge )

WidePoint Corporation (NYSEMKT:WYY) On Friday, the stock price broke out from its trading range with huge volumes. I feel this is the beginning of another bigger move, which is why I will be watching the stock again on Monday. Resistance is $1.75, which was Friday’s high of the day. The price can head towards the 2-2.10 zone. If this zone is surpassed, getting to 2.5 would be a possibility. Add to your position once there is a close above 1.75. The technical chart shows a continuation of the uptrend with MACD/RSI in the Bullish areas and with the AC/DT line showing a clear indication of accumulation. Long setup.

( click to enlarge )

ExOne Co (NASDAQ:XONE) The short-term outlook is bullish. Fresh long should be made only when the stock closes above $64 with an up candle. On the technical side, the investor sentiment in stock showed by RSI continues strong and MACD still going up. Long setup.

( click to enlarge )

Kandi Technologies Group Inc (NASDAQ:KNDI) stock price broke through the highs set in September and should continue to move. I'm buyer of KNDI once it breaks through Friday’s high of $10.48 for the continuation move. The stock will move very quickly, so watch it closely on Monday.

( click to enlarge )

Rigel Pharmaceuticals, Inc. (NASDAQ:RIGL) made a nice move on Friday and looks ready to continue next week. The stock price is coming up to a big level as the stock is near its 100-day EMA. I will be watching this stock closely on Monday as I expect to see a strong move once the stock breaks through this key resistance level. A move past $2.79 would be a strong indicator of a further uptrend in the stock. Technically the stock looks solid trading above its 9,13 and 20-day exp moving averages and fundamentally looks cheap. My model is long, targeting 3.2-3.3 area.

( click to enlarge )

Zalicus Inc (NASDAQ:ZLCS) was added to my watchlist as a possible bottom bounce-play. Chart is displaying positive divergences on momentum indicators and with the stock in oversold territory, these are the perfect conditions for a short-term rally. This stock can pop big time on any positive news. Stay tuned.

( click to enlarge )

Riverbed Technology, Inc. (NASDAQ:RVBD) was one of the few stocks showing any strength, as the stock was able to close slightly higher on Friday. If the stock price can break through $17.75 we should see a strong upside move. Keep a close eye on RVBD next week.

( click to enlarge )

Molycorp Inc (NYSE:MCP) traded 3x normal daily volume on Friday, as the stock closed up 72c on the day. I will watch the stock next week for a follow through move and have set resistance at $6. The technicals indicators, point to a move higher in the coming days.

( click to enlarge )

Rambus Inc.(NASDAQ:RMBS) I feel there is an upcoming move. The stock price continues to sit in a consolidation range. At some point, the stock price will breakout and I want to be there for this move. Resistance stays at $9.68 that if broken, could send shares to $10.

During the day I tweet many times to my readers. I encourage everybody to subscribe AC Investor Blog twitter and newsletter, so you can receive my trade ideas and stock news in real time.

Disclaimer : This is not an investment advisory, and should not be used to make investment decisions. Information in AC Investor Blog is often opinionated and should be considered for information purposes only. No stock exchange anywhere has approved or disapproved of the information contained herein. There is no express or implied solicitation to buy or sell securities. The charts provided here are not meant for investment purposes and only serve as technical examples. Don't consider buying or selling any stock without conducting your own due diligence.

Thanks for visiting AC Investor Blog.

AC

Labels: , , , , , ,

Bookmark and Share
Contact

About Me

    Photobucket
  • I'm a 48 year old Independent Trader using proprietary technical analysis with more than 20 years experience of investing in the US stock markets. I started this blog in 2006 simply as a way to share my thoughts about capital, risk management, and trading. My blog contains only my personal opinion and is provided for informational purposes only.

  • Benzinga.com supporter

    Benzinga.com supporter


    FREE NEWSLETTER

      Enter your email address:

      Delivered by FeedBurner

      Subscribe my feed :

    Support AC

    • Support AC Investor Blog, Donate with PayPal

    Advertising

      Interested in advertising on AC Investor Blog ? Click Here

    TRANSLATOR

    Site Information

    Stock Market Blogroll

    Friends BLOGROLL

    ARCHIVES

Powered by Blogger
and Blogger Templates


Add to Google


