-Financial Tools Futures Market--TRADE IDEAS-- OPTION ALERTS -BENZINGA PRO-

Saturday, March 13, 2021 

Potential trend reversals for opening Long trades next week
 

( click to enlarge )

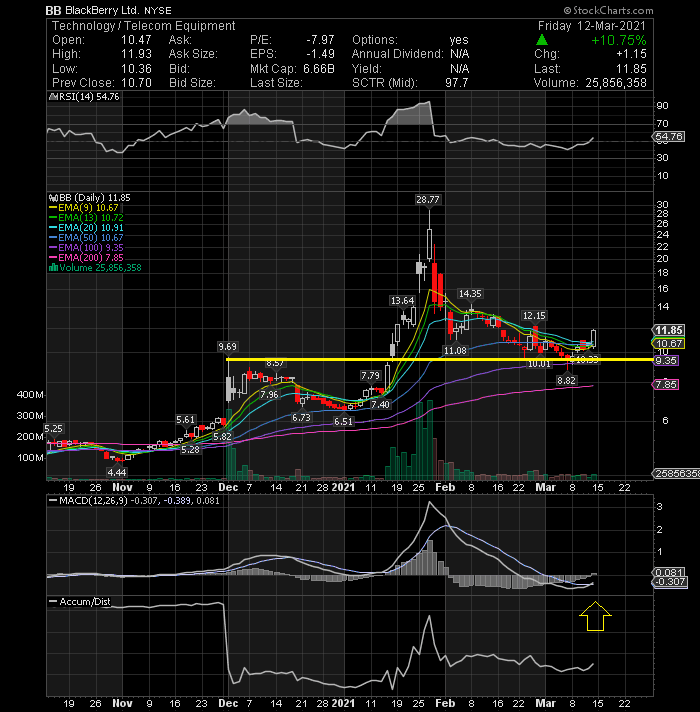
BlackBerry (NYSE:BB) is a stock I wrote about recently as one to watch for a potential reversal as one that has been on my bottom scan. Friday that reversal came to fruition to the tune of an 10.75% gain for the stock. Momentum indicators are looking bullish, with MACD crossing abv the signal line and the RSI breaching 50 and presently lies at 54.76. Watch for continuation next week.
( click to enlarge )

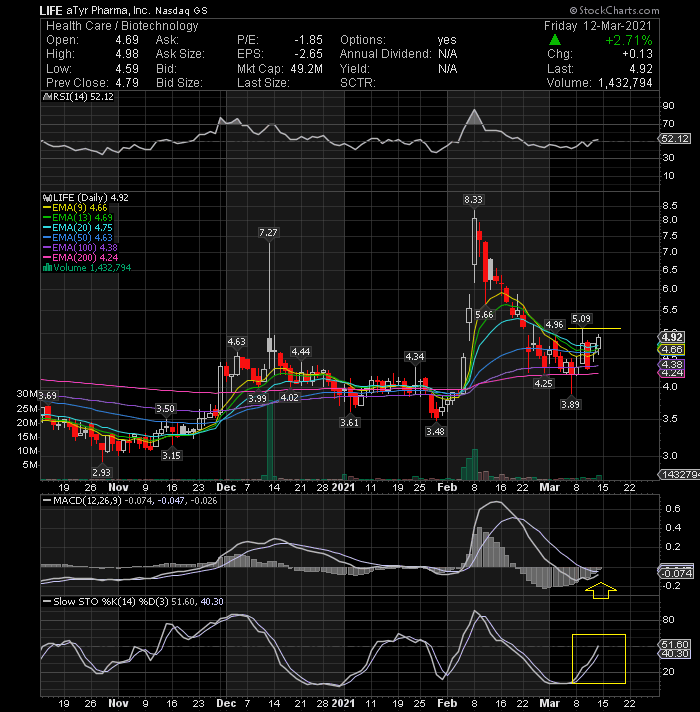
aTyr Pharma Inc (NASDAQ:LIFE) is on the verge of really blowing up. I would not be surprised to see the stock test the $6 level at some point over the next few days. The daily technical chart sure shows a possible reversal in trend coming. Watch Monday's action for a possible breakout over $5.09. The technical indicators such as KD and MACD also show buy signals as the%K line has just crossed on top over %D line and MACD is turning up. The short-term trend is positive as the stock is trading upwards along with short-term EMAs. A break above immediate 5.09 resistance will confirm the bullish trend and the following uptrend will take price up to 6 zone initially.
( click to enlarge )

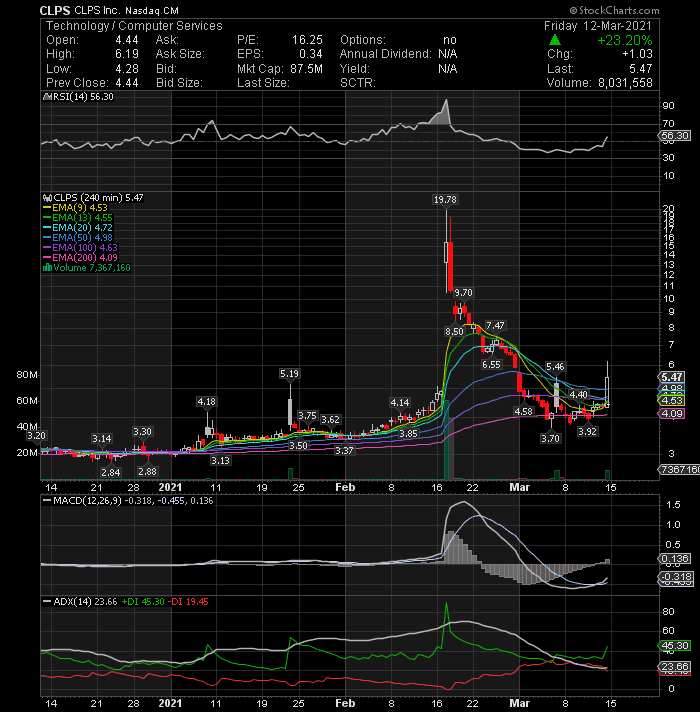
CLPS Inc (NASDAQ:CLPS) gave us a nice move on Friday, which could be the start of a bullish reversal and a short-term bottom. The technical indicators on H4 are looking better for the stock with the MACD indicator above its sell signal line and RSI indicator moving up from the 50% level. Friday Chairman's Letter to the Company's Shareholders is very bullish. The stock was trading at $19.50 in Feb and closed on Friday at $5.47. I think it could see a sharp reversal in the next few sessions. I took a big position.

( click to enlarge )

Neptune Wellness Solutions Inc  (NASDAQ:NEPT) is screaming for a bounce opportunity and I think we can see some nice moves in the coming week. Go long on the break of Friday’s high. Daily technical indicators are in bearish zones but are beginning to show some signs of turning around. MACD and RSI are showing positive divergences by not falling to new lows. Keep it on your watch list. A break of $1.72 with force might give the stock room to $2

( click to enlarge )

BSQUARE Corporation (NASDAQ:BSQR) continues to garner some attention and the stock could explode to the upside in a new rally. I'd look to the $4.97 level moving as the next buy point. If it passes that, then we have room to run to next resistance at $6.75. On the momentum front, I'm seeing some positive divergences in several indicators, such as MACD and RSI on H4

( click to enlarge )

Some serious upside volume coming into  Bit Digital Inc   (NASDAQ:BTBT) over the last few days. Looks like it is getting ready for a big breakout soon. A high volume move through the 18.86 price level would be buyable. Stay tuned.

( click to enlarge )

FSD Pharma Inc  (NASDAQ:HUGE) As you can see in the daily technical chart above, it looks like the stock is ready to continue its recent run higher. The bottom is rounding and technical indicators are beginning to turn positive again. Breakout watch over 2.09

During the day I tweet many times to my readers. I encourage everybody to subscribe AC Investor Blog twitter and newsletter, so you can receive my trade ideas and stock news in real time.

Disclaimer : This is not an investment advisory, and should not be used to make investment decisions. Information in AC Investor Blog is often opinionated and should be considered for information purposes only. No stock exchange anywhere has approved or disapproved of the information contained herein. There is no express or implied solicitation to buy or sell securities. The charts provided here are not meant for investment purposes and only serve as technical examples. Don't consider buying or selling any stock without conducting your own due diligence.

Thanks for visiting AC Investor Blog.

AC

Labels: , , , , , ,

Bookmark and Share

Saturday, March 06, 2021 

Some potential bounce plays to keep an eye on


( click to enlarge )

I think Tesla, Inc. (NASDAQ:TSLA) will have a relief rally next week after its dramatic fall since the January peak of $900. The RSI history of this stock speaks louder. Notice that everytime the daily RSI drops below the 30% level, the stock makes a dramatic rise in the weeks after. The performance history of a stock is always an important parameter in my technical analysis. Nowadays, a lot of traders sell any stock when the daily RSI touches 70 and buy when it falls to 30, however, you must analyze the RSI history before making any trade. History does tend to repeat itself and the majority of the stocks have more than one life in them. Another interesting factor on this long-term chart is that the uptrend of the accumulation line remains practically intact after this big drop, which means the stock is still on the positive swing. These are few reasons why I think now is the time to take a long position at this one, before the stock changes its trend and heads back higher. The bottom looks to be in and the risk of more bloodshed is a lot lower than it was weeks days ago. Lets see if I am right again. NOTE: I took a significant long position on Tesla last week. I won't share my stop loss to avoid algorithms reading it.

( click to enlarge )

Applied UV Inc (NASDAQ:AUVI) with such a great trading day and news, this stock should be closely watched next week. I think there is a good chance for further gains as this stock went from much lower prices, 5 to $35.78 just last month. Could we see that type of rally again? That is the best thing about this market, anything is possible. Yesterday, SteriLumen tweeted that the LEDs in their devices have been proven to kill Coronavirus in seconds. Thats a remarkable argument in pandemic times, which could easily boost its sales. From a technical standpoint, the stock has been consolidating within a falling wedge pattern on H2 that has bullish implications. A breakout is needed to end this large consolidation and resume the uptrend. At this point I'm inclined to mark a key resistance zone around 9.5- 9.75. A move above this area, would break the upper trendline and the resistance zone. If a breakout occurs, we could see an acceleration of the bullish momentum and move toward the 13.75-15 area. Technical indicators are looking bullish, MACD and RSI are showing upward momentum. Now add the bottom play factor along with Yesterday's positive tweet and the potential upwards move gets a little more believable. I doubled my long position before the close.

( click to enlarge )

OLB Group Inc (NASDAQ:OLB) a great trading session and the late last minute buying spree bodes well for next week. Last week the company issued two press releases that were not seriously taken in consideration due to the market behavior. If the market stabilizes next week at these levels and the growth uncertainty reduces, small-caps may outperform and this one could easily run to +$8 again. A break of the $6.54 level could bring $8 and then $8.80 quickly into focus.

( click to enlarge )

Churchill Capital Corp IV  (NASDAQ:CCIV) appears to have bottomed and I think it will turn higher in the short term. Keep a close eye on the stock, as it could break out from here. Breakout watch over 24.98

( click to enlarge )

A quick look at GRNQ's chart will show a stock that has been on the downfall for the last three weeks. Yesterday, the stock held nicely its rising EMA200 meaning we could be seeing at least a temporary bottom. I wouldn't be surprised if this stock popped 15-20% in one session soon.

( click to enlarge )

This spec Oil name New Concept Energy, Inc. (NYSEAMERICAN:GBR) hit a new one-month low yesterday and started to bounce off of them. This should continue next week and we could see a very sharp recovery. GBR was a high flyer later in January. Currently is a good stock to trade, not for investment.

( click to enlarge )

I do believe Camber Energy Inc (NYSEAMERICAN:CEI) will bounce and with continued positive crude Oil news that bounce will turn into a significant trend higher. Add this merger/spec Oil name to your watchlist, this is a knife worth catching.

( click to enlarge )

I think it's fair to say at this stage FSD Pharma Inc (NASDAQ:HUGE) is way undervalued and that the selling has gone far beyond reason. I think a $1.80 break would be very bullish for this stock for a quick run to 2.40

During the day I tweet many times to my readers. I encourage everybody to subscribe AC Investor Blog twitter and newsletter, so you can receive my trade ideas and stock news in real time.

Disclaimer : This is not an investment advisory, and should not be used to make investment decisions. Information in AC Investor Blog is often opinionated and should be considered for information purposes only. No stock exchange anywhere has approved or disapproved of the information contained herein. There is no express or implied solicitation to buy or sell securities. The charts provided here are not meant for investment purposes and only serve as technical examples. Don't consider buying or selling any stock without conducting your own due diligence.

Thanks for visiting AC Investor Blog.

AC

Labels: , , , , , , ,

Bookmark and Share

Saturday, November 28, 2020 

Good looking chart setups to watch next week

Dearest readers,

What a great trading week this past week and looks like plenty of opportunities for the rest of the year. Congratulations to those who have profited on this spectacular week, that is what this blog is all about, if it was not your case, never give up, there are always opportunities. Nothing in this market is easy, but with experience, discipline, instinct, and knowledge you can increase your chances at turning a nice profit. Be humble and the market will show you the way. 

( click to enlarge )

Tilray Inc (NASDAQ:TLRY) There should be plenty of smiles to go around to everyone after yesterday's chart alert (tweeted at 7.45) not only had a big green day, but was crushing resistance levels like little anthills. I want to congratulate anyone that saw the opportunity in TLRY.  Given the recent presidential elections there seems to have been a direct interest in multiple Cannabis tickers throughout this sector of which TLRY has considerable potential being a part of given recent performance. The technical indicators are looking bullish. The RSI has re-entered its bullish territory, the MACD is positive, and above its rising signal line. A break higher above 8.60 on Monday could spark another round of momentum buying. Keep watch because the technicals are indicating there could be more juice left in this stock, offering up multiple intraday entry points. Long setup on watch.

( click to enlarge )

Applied DNA Sciences Inc (NASDAQ:APDN) Another stock with a Cannabis angle. The cannabis legalization is directly connected to APDN traceability technology. The company offers Applied DNA Sciences Portal, a software platform that enables customers to manage the security of company-marked goods, DNA Transfer Systems and Cannabis Tracking System for real-time monitoring. Yesterday the stock made a strong move to the upside, closing near the highs. The stock is setting up to break out and has one more level to go, which is $7.25. The technical indicators are looking mildly bullish. The daily MACD is negative, but rising above its signal line and the RSI has managed to move above their 50% levels. The price can head towards the $8 zone. If this zone is surpassed, getting to $10 would be a possibility. The break of this chart pattern could fuel a short-term price spike because the stock technically has a lot of upside potential, so watch it closely on Monday. Don't be fooled by the large sell orders on the screen in a low float play, generally when a big player wants to sell a large sell order they hide or divide the order never expose it on the screen for everybody to see it. Be smart and dont play the stupid Market maker games.

( click to enlarge )

India Globalization Capital, Inc. (NYSEAMERICAN:IGC) Another name that I alerted yesterday via Twitter for the unusual volume detected. The stock displayed some impressive relative strength with a 30% gain. On the technical side, MACD and ADX all point to an upward trend while RSI is also rising. The stock broke and closed above resistance at $1.75 and should continue to move. The stock hit a high of $2 on Friday, which is resistance for Monday’s move. Keep it on watch.

( click to enlarge )

Genius Brands International Inc (NASDAQ:GNUS) technically also looks interesting. The $1.58 level is an important resistance that once broken will set off a huge run up in stock, the 1st target would be $2 which is the high of August.

( click to enlarge )

Canopy Growth Corporation (NASDAQ:CGC) Broke out to new highs yesterday on decent volume. It entered into the overbought zone RSI 76 but remains healthy, so let it cool down then buy it.

( click to enlarge )

FSD Pharma Inc (NASDAQ:HUGE) Potential breakout play. The break of this major downtrend line next week could be HUGE for this name.

( click to enlarge )

BlackBerry (NYSE:BB) Yesterday, the stock finally broke out of the range it had been trading in the past couple months with a strong close at $6.15. The stock could now move all the way to 6.89, which is the 52-week high.

If you've ever been curious about one of my favorite trading tools, there's never been a better opportunity to take advantage of this offer. TradeIdeas is offering 25% off for the Thanksgiving week. Click HERE and use this CODE: THANKSGIVING25% (applies to first month or first year purchase). It expires Monday, Nov. 30th. Trade-Ideas is my scanning platform. Have a wonderful weekend everyone.

During the day I tweet many times to my readers. I encourage everybody to subscribe AC Investor Blog twitter and newsletter, so you can receive my trade ideas and stock news in real time.

Disclaimer : This is not an investment advisory, and should not be used to make investment decisions. Information in AC Investor Blog is often opinionated and should be considered for information purposes only. No stock exchange anywhere has approved or disapproved of the information contained herein. There is no express or implied solicitation to buy or sell securities. The charts provided here are not meant for investment purposes and only serve as technical examples. Don't consider buying or selling any stock without conducting your own due diligence.

Thanks for visiting AC Investor Blog.

AC

Labels: , , , , , ,

Bookmark and Share
Contact

About Me

    Photobucket
  • I'm a 48 year old Independent Trader using proprietary technical analysis with more than 20 years experience of investing in the US stock markets. I started this blog in 2006 simply as a way to share my thoughts about capital, risk management, and trading. My blog contains only my personal opinion and is provided for informational purposes only.

  • Benzinga.com supporter

    Benzinga.com supporter


    FREE NEWSLETTER

      Enter your email address:

      Delivered by FeedBurner

      Subscribe my feed :

    Support AC

    • Support AC Investor Blog, Donate with PayPal

    Advertising

      Interested in advertising on AC Investor Blog ? Click Here

    TRANSLATOR

    Site Information

    Stock Market Blogroll

    Friends BLOGROLL

    ARCHIVES

Powered by Blogger
and Blogger Templates


Add to Google


