-Financial Tools Futures Market--TRADE IDEAS-- OPTION ALERTS -BENZINGA PRO-

Saturday, July 31, 2021 

Stocks you need to keep an eye on

Dearest readers,

First and foremost I would like to thank everyone for all messages and support over the past months. I just surpassed 150000 followers on Twitter, a remarkable milestone for me. Secondly, wishing all of you a safe vacation period and having lots of fun. There's no question it's a different period of time, but we can't stop living our lives because of the COVID variants. Have a great time with your loved ones.

( click to enlarge )

Bit Digital Inc (NASDAQ:BTBT) is developing a bull flag just under its EMA200 and the breakout should be a nice one if it can hold up. Keep an eye on BTBT as it is starting to tick up. The stock is in a short-term bull market and should continue to go up as both 13 day and 20 day exp moving averages are heading up. At this stage it is definitely a wait and see if the resistance will be easily taken out by the bulls.

( click to enlarge )

Lumos Pharma Inc (NASDAQ:LUMO) The stock was over $12 last month and closed yesterday at $7.60. We could see a sharp rally out of these extreme oversold conditions. With the EMA50 at $11.25 and the EMA200 at much loftier levels, there is a lot of room for this rebound to go. Plus, this company is also trading well below cash levels, which is a great catalyst for a strong rebound. I took a long position on Friday, looking for a potential bounce to double digits.

( click to enlarge )

BSQUARE Corporation (NASDAQ:BSQR) has been pulling back with lower volume after a big surge in price. Might be worth watching for a new move to the upside. If it breaks 3.4 next week, we could see +$5 quickly. I'm in.

( click to enlarge )

Tiziana Life Sciences (NASDAQ:TLSA) bounced nicely off the rising EMA9 again on volume. Based on the chart and price action, I think the stock should test its declining EMA200 very soon. This COVID play deserves your attention going forward. On watch.

( click to enlarge )

Allied Healthcare Products Inc (NASDAQ:AHPI) was one of the biggest winners on Friday as the stock closed up $2.31 on the day with huge volumes. I alerted it when it was trading at $5.94 as a potential big mover and it did not disappoint us. Looking at the technical daily chart the near-term outlook is very positive, with the next pivot point at 10.25. Congrats to all of my followers who profited from it.

( click to enlarge )

Alset Ehome International Inc (NASDAQ:AEI) Despite all the hype regarding Tesla connections, the stock has been a complete disaster. I must admit that i'm losing a significant amount of cash here, but I will play the same strategy as PLUG at the beginning of 2019 when I bought a ton of stock around $1.25 in similar circumstances. Now that the offering is closed, we might start to see some upside movements. I think this will be a stock that will test my patience in the coming weeks/months. Patience is one of my best-known qualities as a trader which helped me achieve many goals in the market and life.

( click to enlarge )

AgriFORCE Growing Systems Ltd (NASDAQ:AGRI) Potential bottom play next week. The stock price has fallen hard over the past several weeks and looks ready for a rebound. The technical daily chart above is not only oversold but also shows a stock ready to post a sizable bounce with several key momentum indicators showing positive divergences.

( click to enlarge )

Keep an eye on Power Integrations Inc (NASDAQ:POWI), looks like it may be setting up for some movement to the upside. Breakout watch over 98.75

( click to enlarge )

Takung Art Co Ltd (NYSEAMERICAN:TKAT) Keep this one on watch, it could be setting up to break out of this rounding bottom base. Go long when it breaks on heavy volume. The $6 price level should be used as a stop.

TRADE IDEAS: The next 2-week Test Drive starts August 9th and runs through August 20th! Test Drive lets non-subscribers or standard subscribers enjoy all Premium Subscription features for up to 2-wks. I recommend signing up b4 Aug 9th so u have the full 2 wks of access. Click on the banner below to know more. One of my best stock scanning tools.



Disclaimer : This is not an investment advisory, and should not be used to make investment decisions. Information in AC Investor Blog is often opinionated and should be considered for information purposes only. No stock exchange anywhere has approved or disapproved of the information contained herein. There is no express or implied solicitation to buy or sell securities. The charts provided here are not meant for investment purposes and only serve as technical examples. Don't consider buying or selling any stock without conducting your own due diligence.

Thanks for visiting AC Investor Blog.

AC

Labels: , , , , , , , ,

Bookmark and Share

Sunday, May 09, 2021 

Potential swing trade ideas for next week


( click to enlarge )

I like this chart on BSQUARE Corporation (NASDAQ:BSQR) alot. Prob one of my favorites right now. It has been forming a potential large falling wedge pattern on the daily chart over the last few weeks, popped on good volume and retreated on lower volume. It looks like it may be starting to gain some momentum and should make a strong move very soon. The falling wedge pattern is a bullish pattern that signals continuation or a reversal depending on the prevailing trend. Basically, it can be defined by a set of lower lows and lower highs that slope downwards and contract into a narrower range before price breaks above the resistance line and a change in trend direction occurs. The technical chart above is clearly displaying a screaming buy divergence on the upside (MACD, RSI, ADX). Let's keep an eye on her as I think momentum will pick up.

( click to enlarge )

I've mentioned Chemomab Therapeutics Ltd (NASDAQ:CMMB) for the bulls out there. On Friday, Oppenheimer initiated coverage on the stock with an Outperform rating and announced a price target of $42 per share. It seems that analysts are also seeing what I'm seeing, a stock trading at bargain prices with a tremendous potential going forward and a very low float. From a technical standpoint, the stock has built a good support around $19.2 and $20 recently and does have the chance to go up. Any breakout above the $25 level next week would be a positive sign.

( click to enlarge )

Cinedigm Corp (NASDAQ:CIDM) The rising 200-day exponential moving average has been a good support reference point for this name to take long positions and that was exactly what I did last week. Lets see if we can get another leg up to retest the 1.60 area again.

( click to enlarge )

Murphy Oil Corporation (NYSE:MUR) Poised to breakout to new highs.

( click to enlarge )

United States Steel (NYSE:X) Nice breakout on strong volume. There is a good chance the stock will continue to move up next week.

( click to enlarge )

Sundial Growers Inc (NASDAQ:SNDL) Potential short-term reversal trend here. Momentum is coming back to this name. Might be worth watching for a new move to the upside.

( click to enlarge )

EHang Holdings Ltd (NASDAQ:EH) is setting up a possible resistance breakout trade. Go long on a close above 24 (Heavily shorted stock)

( click to enlarge )

Skillz Inc (NYSE:SKLZ) price closed above the upper line of the descending channel pattern originated from the April 27 high, creating a significant amount of bullish potential.  On the technical side, MACD and RSI all point to an upward trend. SKLZ has a lot of upside potential, so watch it closely next week. Next major resistance lies around the $18.21 level.

( click to enlarge )

Tenneco (NYSE:TEN) Setting up to clear this resistance area, go long over 13.12 on volume.

( click to enlarge )

Liberty Oilfield Services Inc (NYSE:LBRT) Nice volume on the breakout. Looks great for a test of the highs.

During the day I tweet many times to my readers. I encourage everybody to subscribe AC Investor Blog twitter and newsletter, so you can receive my trade ideas and stock news in real time.

Disclaimer : This is not an investment advisory, and should not be used to make investment decisions. Information in AC Investor Blog is often opinionated and should be considered for information purposes only. No stock exchange anywhere has approved or disapproved of the information contained herein. There is no express or implied solicitation to buy or sell securities. The charts provided here are not meant for investment purposes and only serve as technical examples. Don't consider buying or selling any stock without conducting your own due diligence.

Thanks for visiting AC Investor Blog.

AC

Labels: , , , , , , , , ,

Bookmark and Share

Saturday, March 13, 2021 

Potential trend reversals for opening Long trades next week


( click to enlarge )

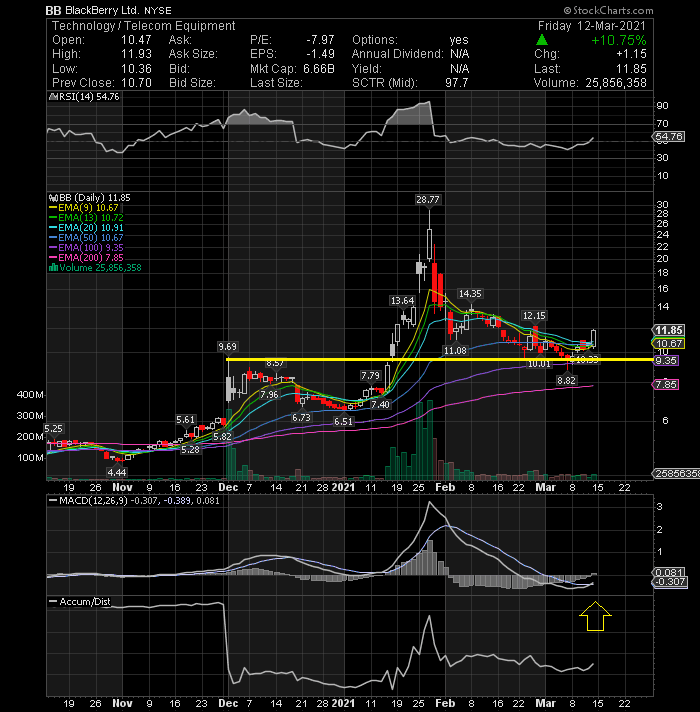
BlackBerry (NYSE:BB) is a stock I wrote about recently as one to watch for a potential reversal as one that has been on my bottom scan. Friday that reversal came to fruition to the tune of an 10.75% gain for the stock. Momentum indicators are looking bullish, with MACD crossing abv the signal line and the RSI breaching 50 and presently lies at 54.76. Watch for continuation next week.

( click to enlarge )

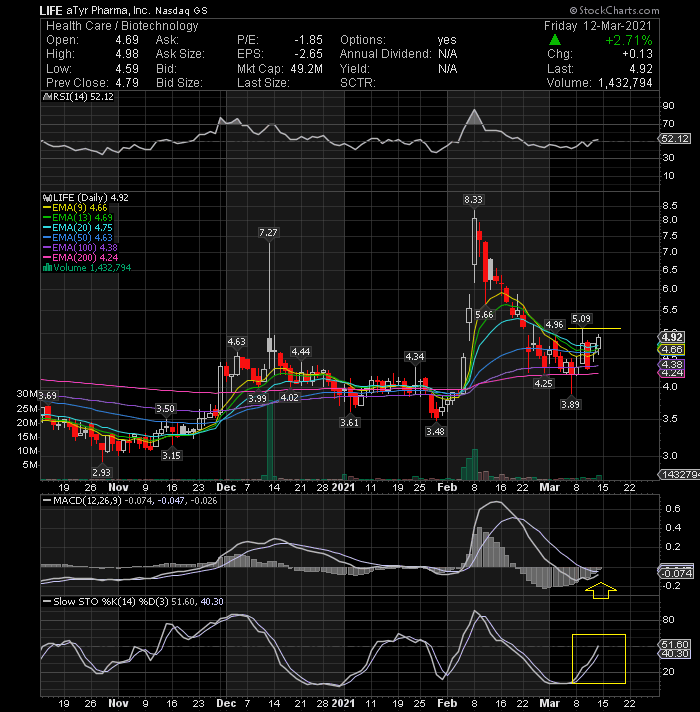
aTyr Pharma Inc (NASDAQ:LIFE) is on the verge of really blowing up. I would not be surprised to see the stock test the $6 level at some point over the next few days. The daily technical chart sure shows a possible reversal in trend coming. Watch Monday's action for a possible breakout over $5.09. The technical indicators such as KD and MACD also show buy signals as the%K line has just crossed on top over %D line and MACD is turning up. The short-term trend is positive as the stock is trading upwards along with short-term EMAs. A break above immediate 5.09 resistance will confirm the bullish trend and the following uptrend will take price up to 6 zone initially.

( click to enlarge )

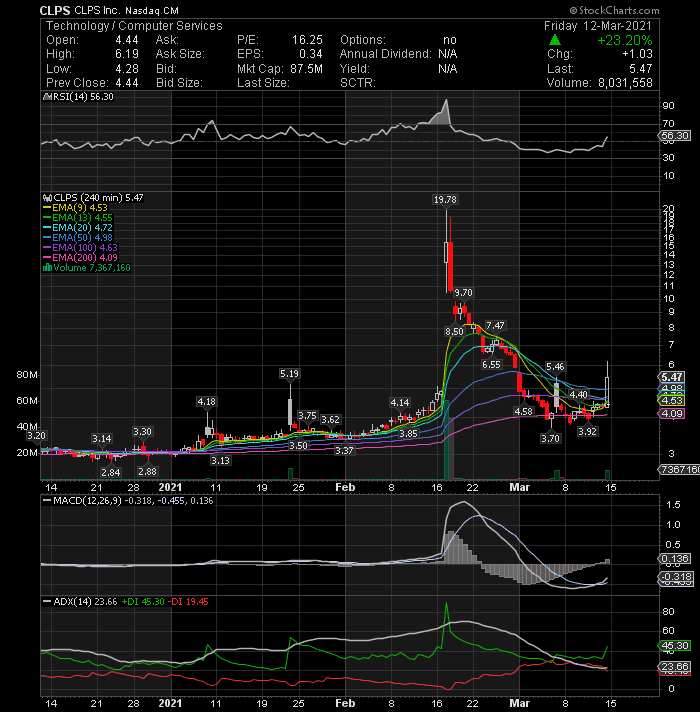
CLPS Inc (NASDAQ:CLPS) gave us a nice move on Friday, which could be the start of a bullish reversal and a short-term bottom. The technical indicators on H4 are looking better for the stock with the MACD indicator above its sell signal line and RSI indicator moving up from the 50% level. Friday Chairman's Letter to the Company's Shareholders is very bullish. The stock was trading at $19.50 in Feb and closed on Friday at $5.47. I think it could see a sharp reversal in the next few sessions. I took a big position.

( click to enlarge )

Neptune Wellness Solutions Inc  (NASDAQ:NEPT) is screaming for a bounce opportunity and I think we can see some nice moves in the coming week. Go long on the break of Friday’s high. Daily technical indicators are in bearish zones but are beginning to show some signs of turning around. MACD and RSI are showing positive divergences by not falling to new lows. Keep it on your watch list. A break of $1.72 with force might give the stock room to $2

( click to enlarge )

BSQUARE Corporation (NASDAQ:BSQR) continues to garner some attention and the stock could explode to the upside in a new rally. I'd look to the $4.97 level moving as the next buy point. If it passes that, then we have room to run to next resistance at $6.75. On the momentum front, I'm seeing some positive divergences in several indicators, such as MACD and RSI on H4

( click to enlarge )

Some serious upside volume coming into  Bit Digital Inc   (NASDAQ:BTBT) over the last few days. Looks like it is getting ready for a big breakout soon. A high volume move through the 18.86 price level would be buyable. Stay tuned.

( click to enlarge )

FSD Pharma Inc  (NASDAQ:HUGE) As you can see in the daily technical chart above, it looks like the stock is ready to continue its recent run higher. The bottom is rounding and technical indicators are beginning to turn positive again. Breakout watch over 2.09

During the day I tweet many times to my readers. I encourage everybody to subscribe AC Investor Blog twitter and newsletter, so you can receive my trade ideas and stock news in real time.

Disclaimer : This is not an investment advisory, and should not be used to make investment decisions. Information in AC Investor Blog is often opinionated and should be considered for information purposes only. No stock exchange anywhere has approved or disapproved of the information contained herein. There is no express or implied solicitation to buy or sell securities. The charts provided here are not meant for investment purposes and only serve as technical examples. Don't consider buying or selling any stock without conducting your own due diligence.

Thanks for visiting AC Investor Blog.

AC

Labels: , , , , , ,

Bookmark and Share
Contact

About Me

    Photobucket
  • I'm a 48 year old Independent Trader using proprietary technical analysis with more than 20 years experience of investing in the US stock markets. I started this blog in 2006 simply as a way to share my thoughts about capital, risk management, and trading. My blog contains only my personal opinion and is provided for informational purposes only.

  • Benzinga.com supporter

    Benzinga.com supporter


    FREE NEWSLETTER

      Enter your email address:

      Delivered by FeedBurner

      Subscribe my feed :

    Support AC

    • Support AC Investor Blog, Donate with PayPal

    Advertising

      Interested in advertising on AC Investor Blog ? Click Here

    TRANSLATOR

    Site Information

    Stock Market Blogroll

    Friends BLOGROLL

    ARCHIVES

Powered by Blogger
and Blogger Templates


Add to Google