-Financial Tools Futures Market--TRADE IDEAS-- OPTION ALERTS -BENZINGA PRO-

Tuesday, May 13, 2014 

Stocks to Watch for May 14, 2014

( click to enlarge )

Hewlett-Packard Company (NYSE:HPQ) is poised to break out of a consolidation pattern. If breakout occurs we could see momentum toward 34. Technical chart shows bullish sign with RSI rising and MACD on top of signal line.

( click to enlarge )

PowerSecure International, Inc. (NYSE:POWR) saw its shares surged almost 10% to $7.19 per share today, after the company announced it had authorized a stock repurchase program worth $5 million. I think there is plenty of room for the stock to run from here.

( click to enlarge )

Eli Lilly and Co (NYSE:LLY) is approaching a breakout point at the 60.65 level. A move above this key resistance level would break the stock out of a consolidation pattern that it has been in for the past 3 months.

( click to enlarge )

Kulicke and Soffa Industries Inc. (NASDAQ:KLIC) is flagging just above the $14 level after a steep rise from the 12.50 level in April.

During the day I tweet many times to my readers. I encourage everybody to subscribe AC Investor Blog twitter and newsletter, so you can receive my trade ideas and stock news in real time.

Disclaimer : This is not an investment advisory, and should not be used to make investment decisions. Information in AC Investor Blog is often opinionated and should be considered for information purposes only. No stock exchange anywhere has approved or disapproved of the information contained herein. There is no express or implied solicitation to buy or sell securities. The charts provided here are not meant for investment purposes and only serve as technical examples. Don't consider buying or selling any stock without conducting your own due diligence.

Thanks for visiting AC Investor Blog.

AC

Labels: , , ,

Bookmark and Share

Saturday, March 08, 2014 

Stocks to Watch for March 10, 2014

( click to enlarge )

WidePoint Corporation (NYSEMKT:WYY) The stock has found resistance for the third time around the 1.67 level. I expect a break of this resistance next week as the short-term outlook is now mildly bullish. If the resistance breaks then further gains towards 1.79 or even for a test of psychological 2 may take place. From a technical standpoint, the technical indicators are in bullish zones. The MACD is moving above its signal line in positive territory and the RSI is moving upwards above its 50% level. All five EMAs are rising and the stock is trading above them. In addition, the trend of the indicator ADX is now starting to increase again, which indicates a long signal.

( click to enlarge )

The overall outlook for Facebook Inc (NASDAQ:FB) stays bullish but the immediate outlook is neutral. The stock is finding the support of 9-day exp moving average currently. If the support holds then further upward gains towards 71.44 and then possibly 71.97 are expected. However, some momentum indicators are showing negative divergences. Hence some caution is required at this point.

( click to enlarge )

Plug Power Inc (NASDAQ:PLUG) is one of the hottest stocks of Nasdaq right now. The stock has been on a non-stop rally since November of 2013 and yesterday it was once again one of the biggest gainers on the NASDAQ, hitting a new 52-week high of $8.35 during intra-day trading. Watch Monday's action for a possible breakout over 8.35. However, this MONSTER stock needs a rest and I'd would like to see a healthy pullback here to work off overbought conditions.

( click to enlarge )

Hewlett-Packard Company (NYSE:HPQ) may be close to breaking to new highs here. The stock has been consolidating the past few weeks, trading in a range with top 30.5 and bottom 29. The volume is starting to pick up and there could be a good short squeeze if the stock breaks out above this range with strong volume. Next week will be for sure a key week for the stock. Keep it on watch.

( click to enlarge )

Terra Tech Corp (OTCMKTS:TRTC) has been doing well this year and last week broke out a short consolidation phase at 60c followed by volume, so keep this stock in your watchlist. A retest of the highs is likely.

( click to enlarge )

E Commerce China Dangdang Inc (NYSE:DANG) Remains under strong buying pressure, however the stock is in an extreme overbought condition, with the 14-day RSI reaching close to 90. Only a break above $19.05 will open doors for much higher.

( click to enlarge )

Ventrus Biosciences Inc (NASDAQ:VTUS) Ready for a bounce. The stock price has been floating around this range (1.40/1.50) for several trading sessions in a row and I think we could see a sharp move higher from here. The technical indicator MACD triggered a buy signal last week, conditions are favorable for a set up. The key level of resistance is the $1.77 level or close to 25% higher than Friday's close. I remain patient and holding a long position.

( click to enlarge )

Rambus Inc. (NASDAQ:RMBS) may be ready to break !! My outlook stays same as last month. A break over 9.81 resistance should take it towards 10.2 to 10.57 resistance area. The psychological pressure of the 10 level may bring some selling pressure but as long as the support over 9.15 holds I expect a break over 10 sooner or later. All Indicators are Bullish, so we could see a continuation of the movement.

During the day I tweet many times to my readers. I encourage everybody to subscribe AC Investor Blog twitter and newsletter, so you can receive my trade ideas and stock news in real time.

Disclaimer : This is not an investment advisory, and should not be used to make investment decisions. Information in AC Investor Blog is often opinionated and should be considered for information purposes only. No stock exchange anywhere has approved or disapproved of the information contained herein. There is no express or implied solicitation to buy or sell securities. The charts provided here are not meant for investment purposes and only serve as technical examples. Don't consider buying or selling any stock without conducting your own due diligence.

Thanks for visiting AC Investor Blog.

AC

Labels: , , , , , , ,

Bookmark and Share

Monday, November 18, 2013 

Stocks to Watch for November 19, 2013

( click to enlarge )

Dendreon Corporation (NASDAQ:DNDN) was a winner today. The stock rose 15 cents, or 5.9 percent, to $2.69. The technical indicators are displaying good signs and the short-term outlook for DNDN appears positive. A close above $2.76 (50EMA) would impart bullishness and would help the stock move to the 3-3.2 range. Stay tuned.

( click to enlarge )

Chart looks bullish. Keep an eye for a possible breakout over $5.91

( click to enlarge )

Associated Estates Realty Corporation (NYSE:AEC) made a strong upside reversal today on heavy volume. The technical chart above suggests that stock might find now resistance at $16.57. Only a close above this level would suggest further upside.

( click to enlarge )

Hewlett-Packard Company (NYSE:HPQ) is looking like the stock price has some more room to the downside here. The near-term outlook is bearish and the stock could drop to the 24-23.5 range. The technical chart shows bearish signs with the stock below its 9 & 13 exp moving averages. In addition, other technical indicators such as MACD and KD also show sell signal as MACD is below signal line and %K line is dropping below %D line.

( click to enlarge )

E-House (China) Holdings Limited (NYSE:EJ) needs to hold the breakout level near the 10.25 level in order to keep the bullish outlook alive.

During the day I tweet many times to my readers. I encourage everybody to subscribe AC Investor Blog twitter and newsletter, so you can receive my trade ideas and stock news in real time.

Disclaimer : This is not an investment advisory, and should not be used to make investment decisions. Information in AC Investor Blog is often opinionated and should be considered for information purposes only. No stock exchange anywhere has approved or disapproved of the information contained herein. There is no express or implied solicitation to buy or sell securities. The charts provided here are not meant for investment purposes and only serve as technical examples. Don't consider buying or selling any stock without conducting your own due diligence.

Thanks for visiting AC Investor Blog.

AC

Labels: , , , ,

Bookmark and Share

Thursday, June 27, 2013 

Stocks to Watch for June 28, 2013

( click to enlarge )

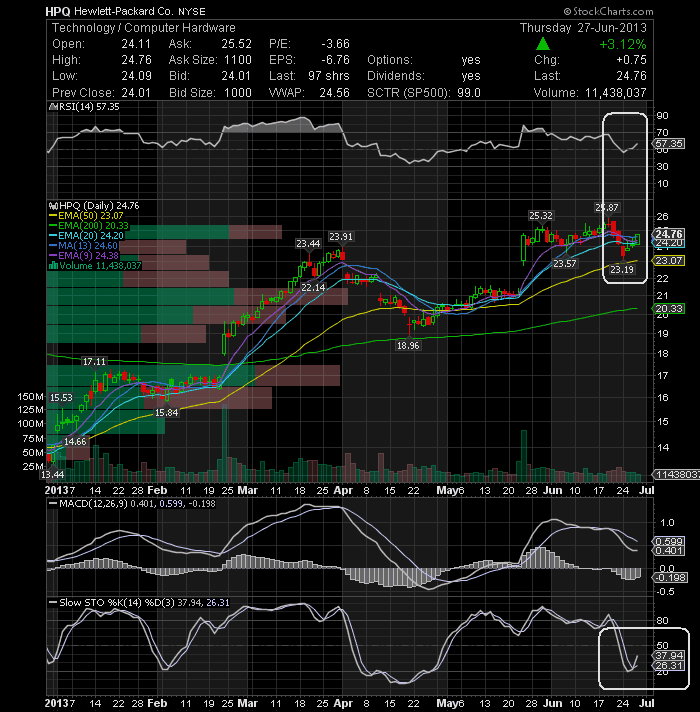
Hewlett-Packard Company (NYSE:HPQ) was able to find support on its 50-day EMA and the RSI confirmed such support. The Slow Sto gave a bullish cross of the %K above the %D line as they emerged out of the oversold zone. The current strength suggests more upside and watch for a break above 25.32 to test strong point at 25.87.

( click to enlarge )

On my swing long list. I think Interpublic Group of Companies Inc (NYSE:IPG) is about to breakout from this consolidation pattern. On the technical charts, the stock currently is trading just above its 13 & 20-day exp moving average lines with both lines providing an additional layer of support for stock. Additionally, the MACD seems to be forming a potentially bullish crossover. With good trading volume, IPG could be poised to trade higher to test its next level of resistence at 14.91. On watch.

( click to enlarge )

Some serious upside volume coming into CapitalSource, Inc. (NYSE:CSE) over the last few days. Looks like it is getting ready for a breakout soon. Stay tuned.

( click to enlarge )

Bank of America Corp (NYSE:BAC) has closed back over its 50-day EMA on decent volume, which is of course bullish. Above that it has the 20-day EMA and 13.25. Note that on this technical daily chart the RSI crossed over 50. Important to see how the stock acts over the next few days. A high volume move through the 13.25 price level would be buyable.

During the day I tweet many times to my readers. I encourage everybody to subscribe AC Investor Blog  twitter and newsletter, so you can receive my trade ideas and stock news in real time.  

Disclaimer : This is not an investment advisory, and should not be used to make investment decisions. Information in AC Investor Blog is often opinionated and should be considered for information purposes only. No stock exchange anywhere has approved or disapproved of the information contained herein. There is no express or implied solicitation to buy or sell securities. The charts provided here are not meant for investment purposes and only serve as technical examples. Don't consider buying or selling any stock without conducting your own due diligence.

Thanks for visiting AC Investor Blog.

AC

Labels: , , ,

Bookmark and Share

Wednesday, May 23, 2012 

Thursday's Stocks To Watch, May 24 2012

( click to enlarge )

From $2.4 to $11.47 in six days. I posted ROSG for my readers and twice for my twitter followers. Today the stock rose more than 51% hitting a high of $11.47. Congratulations to those locking in some profits on this stock. I sold for a gain of 28% in 3 days' time.

 ( click to enlarge )

Apple Inc. (NASDAQ:AAPL) is in a good short-term uptrend. The price has bounced off the low of $522 touched on Friday. If you have purchased at lower levels and are sitting on meaningful profits, hold with a stop at $550. The price can head towards the 590-591 zone. If this zone is surpassed, getting to $600 would be a possibility. From a technical standpoint the chart shows the stock is now back to new rally as %K line is back above %D line. With ROC still at low there is rooms for the stock to go up.

 ( click to enlarge )

Hewlett-Packard Company (NYSE:HPQ) is trading higher after hours, as the company released strong earnings. Right now, the technical chart is in a bearish mode and it's really hard to tell until when it would be. Key resistance is now located at 22.85, a break above this level will confirm a new bullish trend and the following uptrend will take price up to 24-25 zone.

  ( click to enlarge )

Career Education Corp. (NASDAQ:CECO) - Today's huge intra-day reversal suggests that we're literally seeing that the trend is changing.

   ( click to enlarge )

XenoPort, Inc.(NASDAQ:XNPT) made a strong run the last hour of the day, closing near the highs of the day at $5.87. The $5.95 level is a huge obstacle for this stock. If the stock can break through this level, buy the stock and watch it take off. In additon, there is plenty of accumulation on daily chart.

    ( click to enlarge )

Pharmacyclics, Inc. (NASDAQ:PCYC) has been on fire this week. Posted this setup on Monday and its been up over 10% since then. Looks to be getting a little overbought here. Lets see if it can keep running to end the week off.

During the day I tweet many times to my readers. I encourage everybody to subscribe AC Investor Blog  twitter and newsletter, so you can receive my trade ideas and stock news in real time.  

Disclaimer : This is not an investment advisory, and should not be used to make investment decisions. Information in AC Investor Blog is often opinionated and should be considered for information purposes only. No stock exchange anywhere has approved or disapproved of the information contained herein. There is no express or implied solicitation to buy or sell securities. The charts provided here are not meant for investment purposes and only serve as technical examples. Don't consider buying or selling any stock without conducting your own due diligence.

Thanks for visiting AC Investor Blog.

AC

Labels: , , , , ,

Bookmark and Share

Wednesday, July 29, 2009 

Hot stocks - Allscripts-Misys Healthcare Solutions and Hewlett-Packard Company

Chart courtesy of www.stockcharts.com ( click to enlarge )

MDRX broke out to a new all-time high today, accompained by a strong volume suggesting higher levels. The consolidation and compression that has been going on in the last four weeks is very healthy. The technical chart still showing a bullish bias. KD line shows positive signs as K line is rising on top over D line and RSI continue moving up. I suspect the stock may continue to appreciate over the coming days.

Chart courtesy of www.stockcharts.com ( click to enlarge )

HPQ remains one of the hottest stocks on the market. The stock has been in a nice uptrend for the last two weeks and it looks very strong with both 50 day and 200 day moving average going up while K line is on top of D line. HPQ is now on the overbought level, so this means a possible correction is near. This may give us a chance to jump in on the stock when it moves lower. HPQ is a stock to keep an eye on for awhile.

Disclaimer : Trading stocks involves risk, this information should not be viewed as trading recommendations.The charts provided here are not meant for investment purposes and only serve as technical examples.

That's all Folks. See you tomorrow !!

AC

Labels: ,

Bookmark and Share

Saturday, April 25, 2009 

Stocks to watch next week - Canadian Solar, Hewlett-Packard and Amgen

Chart courtesy of www.stockcharts.com ( click to enlarge )

AMGN - The break of the 50-day moving average with heavy volume should be the next buy point on Amgen. The technical daily chart above shows the momentum indicators have turned up and the RSI is on the rise. Although both 50 day and 200 day moving average are showing weakness, KD line is indicating upward swing. For the short term the stock should still continue to go up. A close above 50.05 would have positive implications and could push the stock to the 51-52 range.

Chart courtesy of www.stockcharts.com ( click to enlarge )

HPQ is holding above the 13-day moving average at $34.81. Short-term investors can hold the stock as long as it trades above this support. Any close below this level would indicate that this current rally may be near the end.

Chart courtesy of www.stockcharts.com ( click to enlarge )

CSIQ - The near-term trend is bearish and the stock faces resistance at 6.10-6.39. A close above this range is a pre-requisite for the reversal of the bearish trend. Technically, the daily chart shows possible new rally as K line has crossed on top over D line while ROC is still at oversold level. However it is better to wait and see if the stock can break above its 13 day moving average.

Disclaimer : Trading stocks involves risk, this information should not be viewed as trading recommendations. The charts provided here are not meant for investment purposes and only serve as technical examples.

That's all Folks. See you on Monday !!!

AC

Labels: , ,

Bookmark and Share

Tuesday, November 18, 2008 

Stock Picks and Trade Ideas for Wednesday - HPQ, JDSU, DIS

Chart courtesy of www.stockcharts.com ( click to enlarge )

HPQ shares surged today after solid 4Q outlook. Hewlett-Packard expects earnings of 84 cents per share and adjusted earnings of $1.03 per share for the three months ended in October. From the technical chart the long term trend is still weak as the stock is still below 200 day moving average with the moving average keeps falling. However the stock may be in a rally for the short term as K line has crossed on top over D line. The stock needs to close above $34.18 in order to alleviate the negative near term view. If the stock fails to move above this level, it can decline to $30 again.

Chart courtesy of www.stockcharts.com ( click to enlarge )

DIS - The stock closed moderately higher today. A close above the recent high at $20.98 would reconfirm the current short term uptrend and forecast a test of congestion resistance near $21.25, while a close below support near $20 would predict a test of recent lows in the 19.58 area. The previous support now resistance ( $21.25 ) needs to be surpassed for the medium term outlook to turn positive again. The technical daily chart above shows the stock is in a weak bear market as the stock is below 50 and 200 day moving average and both moving averages kept falling. In addition MACD is also weak as MACD and signal line are below and are declining.

Chart courtesy of www.stockcharts.com ( click to enlarge )

JDSU - There has been a persistent decline in this stock since August tempered with short-lived and unconvincing rallies. Since there are no signals of the stock having reversed yet, I recommend staying away from JDS Uniphase at current levels. Re-investing in this stock can be considered on a daily close above $3.35.

Disclaimer : Trading stocks involves risk, this information should not be viewed as trading recommendations.The charts provided here are not meant for investment purposes and only serve as technical examples.

That's All. See you tomorrow !!

AC

Labels: , ,

Bookmark and Share

Thursday, November 06, 2008 

Stock Picks and Trade Ideas for Friday - HPQ, GM, LDK

Nobody can predict the dimension of the crisis that affects the economy around the world. It was a surprise for many of us, the bankruptcies that have happened and probably those that will follow. This situation is affecting all business decisions, no one has the sense of how to go and where to go. Never, in the recent past, were in that situation. All of us wondering how it was possible to reach such a severe and rapid situation. Today, more bad news were announced by the The International Monetary Fund. It has lowered the projections for global economic growth in 2009. "The outlook for global growth deteriorated in the last month," pointing to a contraction in the economies of the United States, Japan and the euro zone next year. The US economy will shrink 0.7%, Japan 0.2% and the euro zone will suffer a contraction of 0.5%. A month ago, the IMF predicted in its World Economic Outlook ", an expansion in these three regions, 0.1% in the U.S., Japan 0.5% and 0.2% in the euro zone, but now the scenario is much worse. In advanced economies, the contraction expected to GDP in 2009 will be the first since the post-war ", citing the IMF,but these projections are made on the basis of current policies worldwide and that global action in support of the financial markets and give greater fiscal stimulus and monetary relief may help limit the decline in global growth. It will be fair to say that the worst is yet to come.

Chart courtesy of www.stockcharts.com ( click to enlarge )

HPQ - Hewlett-Packard remains in a downtrend and below its October high. There are signs of support around 32-32.5, but no signs of buying pressure. HPQ needs to break above 42 to reverse the current downtrend and revive the stock. I am also watching RSI, which has been trending lower the last few weeks. RSI needs to move above the red trendline extending down from late September to turn momentum bullish.

Chart courtesy of www.stockcharts.com ( click to enlarge )

GM - The near-term outlook is very bearish and the stock could drop to the $4-$4.20 range. Investors who are holding profitable position, may consider selling a portion of their holdings now, because the stock is trading in a dangerous technical situation and you’re hoping and hoping and the stock continues moving lower and lower. The stock is already trading near its October lows and showing relative weakness. The strong support is only at $4.

Chart courtesy of www.stockcharts.com ( click to enlarge )

LDK - This stock is currently correcting the entire up-move recorded since late October. The short-term supports for the stock exist at $17.77 and then at $17.50. The near-term outlook for the stock is negative as it is currently below its long-term average line and is recording a sequence of lower peaks and troughs. This denotes a high selling pressure every time the stock attempts to move higher. You can hold the stock with a stop at $17.50. Technically Bearish.

Disclaimer : Trading stocks involves risk, this information should not be viewed as trading recommendations.The charts provided here are not meant for investment purposes and only serve as technical examples.

That's All. See you Tomorrow !!!

AC

Labels: , ,

Bookmark and Share

Saturday, September 20, 2008 

Stocks to watch next week - SPIR, AMZN, BIDU, HPQ

Chart courtesy of stockcharts ( click to enlarge )

HPQ - The technical chart shows very positive sign as the stock has bounce back up after dropping near 50 day moving average. Now that K line is on top of D line again the stock should enjoy a new rally. The overall outlook for the stock appears bullish. Only a close below $46.19 would negate the bullish outlook for the stock.

Chart courtesy of stockcharts ( click to enlarge )

BIDU - MACD has already generated a buy signal. The near-term outlook for the stock does not appear negative. Only a close below $280 would have negative implications. Hold on with a stop loss at $280. Fresh buying may be avoided as long as long as the stock is traded below $312 ( 200 day moving average ). A move past this level may be used to take fresh exposures.

Chart courtesy of stockcharts ( click to enlarge )

AMZN - The technical daily chart shows very positive sign as the stock is now trading above 50 day moving average and formed this week the golden cross pattern. This “Golden Cross” pattern represents a major shift from the bears to the bulls. Golden cross is when the 50-day moving average cross on top over 200-day moving average and is a very bullish buy signal. With K line back above D line and stock back above 50 day MA we may see some rally coming. The stock is now in a Bullish mode.

Chart courtesy of stockcharts ( click to enlarge )

SPIR is a low volume small cap that may be poised to move higher. This stock broke out on Friday from its bearish descending traingle. The technical chart shows very positive sign as the stock is now trading above 50 day and MACD back again above 0. This momentum could push this stock much higher from here, so keep it on the radar next week.

Disclaimer : Trading stocks involves risk, this information should not be viewed as trading recommendations.The charts provided here are not meant for investment purposes and only serve as technical examples.

That's All. See you Monday !!!

AC

Labels: , , ,

Bookmark and Share

Monday, February 25, 2008 

Stocks to watch tomorrow - JNPR, HPQ, AMZN, JASO

Chart courtesy of stockcharts

JASO - Daily chart above shows that it is still to early to say that the downtrend has ended. Stay tuned on her for a possible breakdown below the support level at $15.16 on a close basis.

Chart courtesy of stockcharts

AMZN - Not a pretty picture. The short term trend is still weak as the stock has been trading below 50-day moving average and 200-day moving average, with 50 day MA now going downward showing bearish signal. Stock still in downtrend mode. It is better to stay at the sideline and see how the stock react for the next few days as the stock has approached the pressure line of 20-day moving average. Shares were up 1.6% but with low volume, a clear signal of weakness to move up.

Chart courtesy of stockcharts

HPQ - The stock closed above its 200-day moving average of $47.76, which is a very bullish sign. From a technical perspective stock still looks bullish and there is no evidence we can see for a major correction just yet.

Chart courtesy of stockcharts

JNPR - Juniper shows a possible inverted head-and-shoulders pattern on the daily chart with a neckline at $28. We will have to wait and see. The big movement in the past few days tells me to be patient. Buy point is when it crosses the neckline at $28 on heavy volume.

Disclaimer : Trading stocks involves risk, this information should not be viewed as trading recommendations. The charts provided here are not meant for investment purposes and only serve as technical examples.

That's All. Have a nice evening !!!

AC

Labels: , , ,

Bookmark and Share

Thursday, February 21, 2008 

Stocks to watch tomorrow - HPQ, CSIQ, BAC, AMZN

Chart courtesy of stockcharts

Amazon shares lost 5 percent of their value on today session with high volume. In a Form 4 filed with the SEC, Jeffrey P. Bezos reported he sold 1.85 Million shares for $73.21 apiece on Friday, causing some panic on investors, which generally is not a good news for market and shareholders. The technical chart shows weakness as the stock is trading below major moving averages. In addition, MACD is losing ground and is approaching of the sell signal. Another negative indicator is KD where K line is below D line which could mean more share price decline. First support is now at $67.22.

Chart courtesy of stockcharts

BAC - The daily chart shows that the stock is moving in sideways since the beginning of February. Stock closed today below its 20-day moving average near the bottom of the channel. Macd Fast line crossed below 0 line or macd slow line, below 0. Indicates start of a new downtrend. Watch for a breakdown of the channel mentioned above, for a possible short position. RSI is also declining.

Chart courtesy of stockcharts

CSIQ - The stock is moving in an upward channel since the low of $15 made in January. However I'm a little worried with fact that all indicators are appointing for a possible breakdown of the channel, so if you're long on this stock, hold with a stop-loss at $19,67.

Chart courtesy of stockcharts

HPQ - The 200 day moving average is acting as resistance on HPQ. This stock keeps having good earnings and has had some great runs in the past. Maybe it is about to start another one. Buy point would be on the day it blows through its 200 day moving average on heavy volume.

Disclaimer : Trading stocks involves risk, this information should not be viewed as trading recommendations. The charts provided here are not meant for investment purposes and only serve as technical examples.

That's All. Have a nice evening !!!

AC

Labels: , , ,

Bookmark and Share
Contact

About Me

    Photobucket
  • I'm a 48 year old Independent Trader using proprietary technical analysis with more than 20 years experience of investing in the US stock markets. I started this blog in 2006 simply as a way to share my thoughts about capital, risk management, and trading. My blog contains only my personal opinion and is provided for informational purposes only.

  • Benzinga.com supporter

    Benzinga.com supporter


    FREE NEWSLETTER

      Enter your email address:

      Delivered by FeedBurner

      Subscribe my feed :

    Support AC

    • Support AC Investor Blog, Donate with PayPal

    Advertising

      Interested in advertising on AC Investor Blog ? Click Here

    TRANSLATOR

    Site Information

    Stock Market Blogroll

    Friends BLOGROLL

    ARCHIVES

Powered by Blogger
and Blogger Templates


Add to Google