6 Technical Setups to keep an Eye On
The irrationality is back to the market. This is the best time for investors to act and manage the risk to protect value and maximize returns on great investment opportunities that are now showing up. Do not fear the market. Be always confident in your trade decisions.
To make this a way of life, you must continue to do so in good and in bad markets. Make sure you can afford to lose the money invested, something unexpected might happen.
.PNG)
( click to enlarge )
On Friday, Blackberry stock closed back above the prior late-April low of 5.57 accompanied with heavy volume, which is a crucial level for bulls to defend next week. From here, it looks like it may be headed for a test of the 50EMA. The momentum indicators also are showing signs of strength. BB is likely to gain momentum and is expected to move up further.
.PNG)
( click to enlarge )
On Wednesday, shares of Apple sold off on heavy volume but closed yesterday slightly above its major support zone. As a big-stock leader, this stockL should be watched carefully here next week since a continuation of last week's heavy selling that pushes the stock below this key support area would be bearish. Momentum indicators are showing some short-term pause but I don't see a sharp rally coming yet.
.PNG)
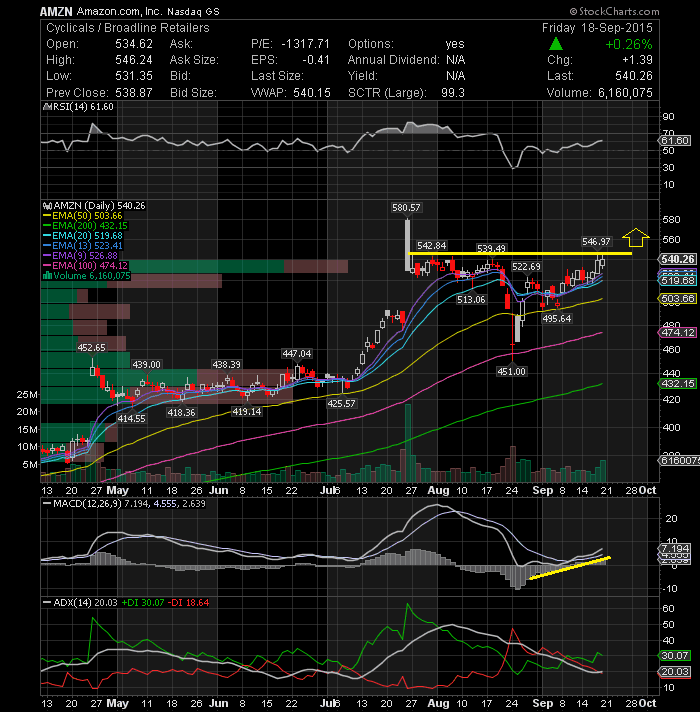
( click to enlarge )
Shares of Amazon also bounced off logical support along the top of its prior Oct 2018 consolidation, which also coincided with its prior Jul 2019 consolidation. If this major support zone is broken, then we may see things get exciting again. For now, we are in a wait-and-see position. The volatile and unpredictable stock market action makes this difficult to figure out right here, right now, so we will see how this develops in the coming days/wks. Only a close above 2500 would bring fresh buying interest in the stock again.
.PNG)
( click to enlarge )
This is a sector that could greatly benefit from the food shortage. Shares of AGRI pushed right through resistance around the $1.55 price level and the 9EMA yesterday, which would have been a quick stop-out for anyone :) trying to short the stock at resistance. Very nice pattern broken on the daily chart. We might see a continuation move towards 2.05
.PNG)
( click to enlarge )
Shares of H&R Block (NYSE:HRB) posted an all-time closing high yesterday and remains extended. Buyable on a pullback to pivot.
.PNG)
( click to enlarge )
I am a holder of CLXT, another food play that could play a big role in the Ag sector. The stock has seen a strong volume uptick and it is trying to break the downtrend channel range. A break of this pattern resistance could mean the stock is breaking out and potentially ready to see a long-term trend change as it shakes off the recent pessimism behind the stock.
Disclaimer : This is not an investment advisory, and should not be used to make investment decisions. Information in AC Investor Blog is often opinionated and should be considered for information purposes only. No stock exchange anywhere has approved or disapproved of the information contained herein. There is no express or implied solicitation to buy or sell securities. The charts provided here are not meant for investment purposes and only serve as technical examples. Don't consider buying or selling any stock without conducting your own due diligence.
Thanks for visiting AC Investor Blog.
AC
Thanks for visiting AC Investor Blog.
AC
Labels: AAPL, AGRI, AMZN, BB, CLXT, HRB
| Permalink | ![]()