Ten stocks worth watching next week

( click to enlarge )
FuelCell Energy Inc (NASDAQ:FCEL) Good solid stock moving higher on expansion volume. 7.86 is the pivot here. If it breaks, we could see 8.50 quickly. Use the rising EMA20 as stop-loss. Technical indicators are also supporting the bulls. The MACD crossed above the signal line on positive territory, RSI is moving up and above its 50% level. Long setup on watch.

( click to enlarge )
Adamis Pharmaceuticals Corp (NASDAQ:ADMP) Watch Monday's action for a possible breakout over $1.15 PDUFA is coming up soon so I wouldn't wait too long to jump aboard. Plus, ADMP is on the list of the Most Bought by Activist Hedge Funds.
( click to enlarge )
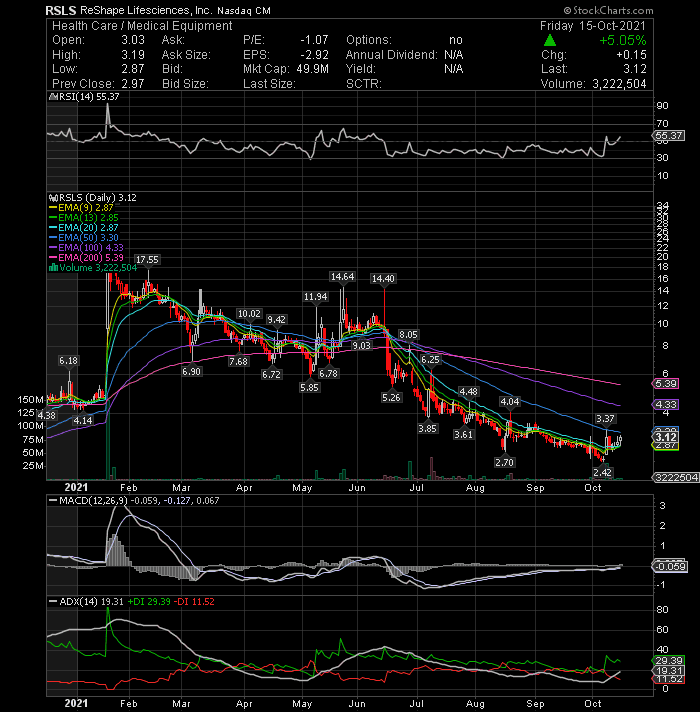
ReShape Lifesciences Inc (NASDAQ:RSLS) looks about ready to pop here! Setting up a possible resistance breakout trade. Technical indicators are supporting a continuation of the recent move higher. The RSI is moving back higher in the bullish zone and the MACD is crossing up. On my fireworks list.

( click to enlarge )
Orbital Energy Group Inc (NASDAQ:OEG) deserves some attention as a potential bounce candidate. It is recovering from its bottom with MACD & Slow Sto moving upwards. If the stock holds above $2.87, the price may rise to the 3.52-3.7 range in the short-term. I have been accumulating this stock. Tremendous potential imho.

( click to enlarge )
Mercurity Fintech Holding Inc (NASDAQ:MFH) continued to show strength with another gain. Friday's rally put shares above the psychological resistance level of $2.50, which is a very bullish sign. This key resistance zone was taken out with a thrust and could lead to more upside.

( click to enlarge )
Silverback Therapeutics Inc (NASDAQ:SBTX) is another oversold stock showing signs of potential trend change. A breakout above $10.45 would constitute a technical entry point for the short-term trader, looking for a quick trade.
( click to enlarge )
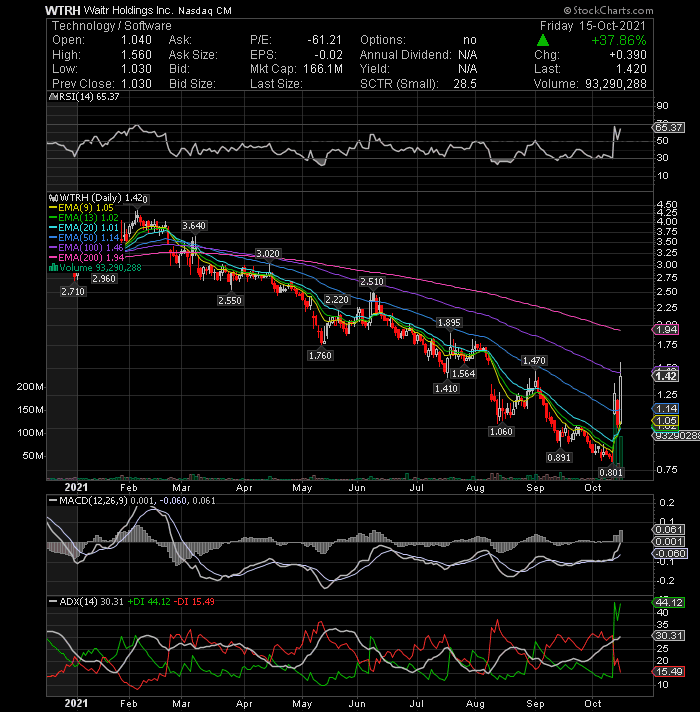
Waitr Holdings Inc (NASDAQ:WTRH) This rally seems like it is getting some momo again. A close above the 1.50 level would be a strong indicator of a further uptrend in the stock. On watch.

( click to enlarge )
Shares of Tonix Pharmaceuticals Holding Corp (NASDAQ:TNXP) are starting to heat up again and are worth watching in the coming future. Phase 3 results of Tonmya (TNX-102 SL) to be presented at ACR November 6, 2021 If volume can pick up, I think this stock can break through resistance at 60c and re-test its recent highs around 80c (gap zone).

( click to enlarge )
Alcoa (NYSE:AA) had a strong move on Friday, as the stock set new 52-wk highs. The stock hit a high of $56.93, which is resistance for the follow through move. You should watch this stock closely on Monday for continuation.

( click to enlarge )
Protagonist Therapeutics Inc (NASDAQ:PTGX) the more it consolidates the more powerful it gets! A break of 33 next week should bring the buyers into this stock in a big way.
Disclaimer : This is not an investment advisory, and should not be used to make investment decisions. Information in AC Investor Blog is often opinionated and should be considered for information purposes only. No stock exchange anywhere has approved or disapproved of the information contained herein. There is no express or implied solicitation to buy or sell securities. The charts provided here are not meant for investment purposes and only serve as technical examples. Don't consider buying or selling any stock without conducting your own due diligence.
Thanks for visiting AC Investor Blog.
AC
Thanks for visiting AC Investor Blog.
AC
Labels: AA, ADMP, FCEL, MFH, OEG, PTGX, RSLS, SBTX, TNXP, WTRH
| Permalink | ![]()


