-Financial Tools Futures Market--TRADE IDEAS-- OPTION ALERTS -BENZINGA PRO-

Sunday, October 09, 2016 

My Watchlist for Monday, October 10

( click to enlarge )

IntelliPharmaCeutics Intl Inc (NASDAQ:IPCI) The company on Friday received tentative approval from the U.S. FDA for the Company's abbreviated new drug application for quetiapine fumarate extended-release tablets in the 50, 150, 200, 300 and 400 mg strengths. This press release was announced after the markets closed. In after-hours trading, the stock closed with a gain of 50% at 3.57. It will be interesting to see pre market on Monday how it starts out. On the long-time frame above, you can see the pivot resistance points. I mentioned several times on twitter that IntelliPharmaCeutic was looking constructive from a technical standpoint, with the A/D indicator (accumulation/distribution line) showing clear signs of accumulation. A huge congratulation’s to you, if you paid attention to my alerts on IPCI, as you are probably sitting on same pretty hefty gains at the moment. I will use the pivot resistance points and the price targets of analysts to determine my exit strategy. To receive my alerts before the crowd follow me on twitter.

( click to enlarge )

Tokai Pharmaceuticals Inc (NASDAQ:TKAI) is another stock I have mentioned a few times in the past few weeks showing steady accumulation on charts. I believe things will heat up this month and have based my bullish position on the following factors:

- My system detected unusual call buying in the Oct/Nov 5 and 7.5 calls respectively last month
- Steady accumulation on charts - All short-term EMAs are now rising.
- The company is trading below cash per share.
- It recently broke a bullish flag higher, so a new leg up could possibly be a measured move of that same extent, as chart shows. At this point I see another potential major rally right around the corner.
- Most importantly, on September 8th, the company announced that its Board of Directors has initiated a review of strategic alternatives for the company focused on maximizing stockholder value. 

As i said several times on twitter, I still holding my shares because i do think it could reach the $2 price level or more in the coming sessions. Be sure to get it on your radars. Im long and I have a stop located at 1.24

( click to enlarge )

Adverum Biotechnologies Inc (NASDAQ:ADVM) During mid-Sept, the price broke out of the key resistance line on high volume and back tested the downtrend line Friday on very low volume. The stock already has a robust set of technicals, including a strong accumulation on charts and has a strong cash-position (>$5.9 per share). I believe this stock could stage a strong bounce off this area of support.

( click to enlarge )

I am also eyeing ACADIA Pharmaceuticals Inc. (NASDAQ:ACAD) as a potential bounce play next week. We could see a strong bounce off these lows up towards 30 over the next few sessions due to its extreme oversold state.

( click to enlarge )

I detected unusual call volume in DHT Holdings Inc (NYSE:DHT) on Friday. Watch this stock if it breaks next week above the 4.57 price level. It's a short-squeeze candidate.

If you want to contact me for advertising opportunities on blog or twitter, then get in touch via email

Disclaimer : This is not an investment advisory, and should not be used to make investment decisions. Information in AC Investor Blog is often opinionated and should be considered for information purposes only. No stock exchange anywhere has approved or disapproved of the information contained herein. There is no express or implied solicitation to buy or sell securities. The charts provided here are not meant for investment purposes and only serve as technical examples. Don't consider buying or selling any stock without conducting your own due diligence.

Thanks for visiting AC Investor Blog.

AC

Labels: , , , ,

Bookmark and Share

Saturday, July 30, 2016 

This is my watchlist of stocks for Monday 01 Aug

( click to enlarge )

aTyr Pharma Inc (NASDAQ:LIFE) which broke out of a falling wedge on Wednesday and consolidated Thursday, continued to move higher Friday on heavy volume closing the session above the important price level of 3.39. This could push the stock above its next resistance level in the 4 area towards the 4.05-4.35 trading range in the next couple of trading days. This technical set-up appears to be near perfect to deliver good gains. The ADX value is increasing and above the 30 level and +DI is above the –DI indicating development of strong up trend. The MACD indicator is also above its signal line indicating further strength may be possible.


Plus, the insider transaction chart also is showing bullish signal as all transactions have been purchases of stock. In addition the institutions are also bullish, Tang Capital just bought 190k shares in Q1. We could see some impressive movement next week. I took a strong position for a swing trade here (tweeted at 2.96).

( click to enlarge )

Merrimack Pharmaceuticals Inc (NASDAQ:MACK) is a candidate to be traded in breakout mode next week. The Daily technical indicators are looking better for the stock with MACD indicator above its sell signal line, %K line on top of %D line and RSI indicator moving up above the 50% level. This is one for the bottom pickers. Upside volume is picking up and a small rounding bottom is also taking shape. Keep an eye for a possible breakout over $5.90.

( click to enlarge )

ZIOPHARM Oncology Inc. (NASDAQ:ZIOP) has recovered nicely and can potentially set-up very well for a swing-trade next week if the stock breaks through the resistance level at $5.11. From a technical standpoint the RSI is coming out of oversold territory, MACD is curling up and Slow Stochs crossover and upward turnaround. The break of the resistance 5.11 with heavy volume should be the next buy point on ZIOP.

( click to enlarge )

Shares of Repros Therapeutics Inc (NASDAQ:RPRX) traded nicely on Friday and I’m looking for continuation of the upward direction next week. From a technical standpoint, the daily chart looks Bullish with all short-term EMAs going up and MACD on top of 0, RSI in a Bullish area too. I'm setting resistance at $2.20, which was the high of Friday. If the stock breaks through, the next resistance lies at $2.4.

( click to enlarge )

MGT Capital Investments Inc. (NYSEMKT:MGT) had a strong bounce off the 2.61 level last week accompanied by a nice pickup in volume. If the stock holds above $3, the price may rise to the 3.30-3.50 range in the short-term. The daily technical indicators are also confirming with positive signs. MACD histogram is starting to rise and the RSI is curling higher.

( click to enlarge )

BlackBerry Ltd (NASDAQ:BBRY) We may see some consolidation above the 7.45 level (breakout zone) after the sharp run-up in the past few sessions. The strong accumulation over the past days has shown funds moving into the company and moved share prices upward. I expect the current reversal in trend to continue.

( click to enlarge )

FireEye Inc (NASDAQ:FEYE) consolidated on Friday and formed an inside bar candle pattern above the 100-day EMA support line, which indicates a pause in the up move. Overall the bias still remains bullish.

( click to enlarge )

ACADIA Pharmaceuticals Inc. (NASDAQ:ACAD) has not done much in the past week but continues to manage its bullish consolidation above all major EMAs. A sustained break of $38 should bring the stock price to a test of the recent highs in the $42 area. From a technical standpoint, daily technical indicators are in bullish zones. The MACD is rising and in the positive territory. RSI is above its 50% level and the Slow stochastic is inside its overbought zone. All five EMAs are rising and the stock is trading above them. Watch this "bullish" consolidation for the next directional clue.

As usual on the weekend post, I use some space in my “blog” to talk about the progress of the app I have embraced in the past weeks. Some of you know, others not, this app continues to be FREE of charge, but in the next few weeks this will change and they will start a premium service with a top experience for users. As an investor, people need help in 3 main areas - identifying potential stocks to invest in, figuring out when to buy/sell, stay on top of important information. Frankly, I am hearing from a number of my readers that the Stockal app does a pretty good job of these things. First up, it has news, analyst articles, curated social chatter and respective decision making signals all-in-one-place for most stocks. Then for every stock it can tell you when trader sentiment falls or rises or analyst opinion changes or revenue is predicted to move significantly - pretty much what you need to know to decide whether "now" is a good time. Finally, Stockal's Trending Stocks feed is good for identifying the stocks which are likely to move or are already moving. It's all quite comprehensive! Plus, you can trade directly inside the app itself. Get it for iPhone and Android .

Disclaimer : This is not an investment advisory, and should not be used to make investment decisions. Information in AC Investor Blog is often opinionated and should be considered for information purposes only. No stock exchange anywhere has approved or disapproved of the information contained herein. There is no express or implied solicitation to buy or sell securities. The charts provided here are not meant for investment purposes and only serve as technical examples. Don't consider buying or selling any stock without conducting your own due diligence.

Thanks for visiting AC Investor Blog.

AC

Labels: , , , , , , ,

Bookmark and Share

Saturday, July 09, 2016 

Good looking setups in the biotech space for next week

( click to enlarge )

ACADIA Pharmaceuticals Inc. (NASDAQ:ACAD) jumped 3.31% Friday on solid volume crossing the 20-day exponential moving average and breaking key resistance at $34.58. These signs, show high probability for continuation of the current bullish momentum in the next couple of trading days. We could see extension of this new momentum towards the 36 area. Daily technical indicators are supporting the bulls. The MACD is curling up while the RSI is moving up and above its 50% level. Plus, the accumulation/distribution line is also rising on the charts, which represents buying. On watch for continuation.

( click to enlarge )

Relypsa Inc (NASDAQ:RLYP) looks strong on charts. The stock yesterday closed above its 200-day exponential moving average of 19.74 with high volume. Its daily technical indicators are showing positive signal and its price bars are trading above the major EMA's, denoting the current positive tone may turn into a new uptrend soon. The daily MACD continues to trade in the positive zone and the A/D is also turning up which means there is more money flowing into the stock. I remain bullish on RLYP.

( click to enlarge )

Sarepta Therapeutics Inc (NASDAQ:SRPT) displayed relative strength last week and price finally broke through the 200-day EMA on decent volume. The close near its high on Friday also should bode well for the stock in the coming week too. From a technical perspective, the MACD indicator just crossed above signal and the stock is now back above all the major EMAs, giving the bulls the signal they wanted. It has momentum back on its side. I will be watching the stock on Monday, looking for a follow through move. Next major resistance lies around the 24.3/60 area.

( click to enlarge )

Clovis Oncology Inc (NASDAQ:CLVS) price action is coiling up here in anticipation of a breakout w/ directional conviction. I have highlighted a potential ascending triangle pattern, which if confirmed would project a target around $17. Also take note that on the daily time-frame the MACD has been moving up and the RSI is in the bullish zone, indicating bullishness. CLVS will move very quickly, so keep a very close eye on the stock.

( click to enlarge )

Valeant Pharmaceuticals Intl Inc (NYSE:VRX) is starting to heat up and I would not be surprised if it hit $25 at some point next week. This bottom play has started to bounce nicely off its bottom and momentum indicators are giving a clear picture of a short-term upward bias (MACD, Slow stochastics and RSI are all rising). If the stock can break through $24.25, we should see strong volume drive the stock higher. A lot of eyes are on VRX right now so make sure this is on your radar screens.

( click to enlarge )

Arena Pharmaceuticals, Inc. (NASDAQ:ARNA) seems to have bottomed and is ready for a decent bounce to 1.80 levels where it faces some resistance. We will have to watch the stock around those levels. If you are long, initial stoploss should be placed at 1.56 (trendline). Let's keep an eye on ARNA as i think momentum will pick up.

( click to enlarge )

The iShares NASDAQ Biotechnology Index (ETF) (NASDAQ:IBB) also closed sharply higher last week, recovering from the weakness caused by the Brexit event that drove the index into its lowest level since February. Although the index is getting stretched, the technical indicators suggest there is more upside and the rally should continue next week targeting the next resistance levels at 285 and 289.

For this weekend, I definitely recommend everyone to try this application while it still free. If you are an individual investor and keep looking for various ways to manage your stocks smartly, it might be a good idea to download the Stockal app to discover and follow stocks. In times when most apps and websites overwhelm you with data, "Stockal" pre-analyses tons of information and gives you very simple indicators for every stock out there. These indicators tell you how a stock is likely to perform; and Stockal creates these by crunching analyst reports, news, social chatter and company revenue figures. So you get a holistic view of any stock. You can also read analyst articles, news, curated Twitter & StockTwits chatter etc - all in one place, without having to visit multiple websites or apps. Cool thing is, here's a platform where you can also link your brokerage account so that you can seamlessly place trades whenever ready. "Stockal" currently works with TD Ameritrade, Fidelity, E*Trade, Robinhood, OptionsHouse, TradeStation and a couple more brokerages. It's all just as secure as your brokerage account. Get the app here: iOS , Android They have a great IT team and management. I will definitely keep an eye on the progress of this project and will let you guys on a weekly basis the new features that they will introduce.

Disclaimer : This is not an investment advisory, and should not be used to make investment decisions. Information in AC Investor Blog is often opinionated and should be considered for information purposes only. No stock exchange anywhere has approved or disapproved of the information contained herein. There is no express or implied solicitation to buy or sell securities. The charts provided here are not meant for investment purposes and only serve as technical examples. Don't consider buying or selling any stock without conducting your own due diligence.

Thanks for visiting AC Investor Blog.

AC

Labels: , , , , , ,

Bookmark and Share

Saturday, June 04, 2016 

Stock to watch for next week

( click to enlarge )

Lets take a look at Relypsa Inc (NASDAQ:RLYP) activity in the light of the recent successive price increases. Looking at the daily technical chart above, we can see that the stock is positively reacting to the recent events. The good side of this stock technically is that the MACD is still rising above the zero line and the RSI is above its 50% level, so this stock is still bullish for now even if it is still consolidating. As long as the price trades above the $18 level, there is no threat for any sharp fall in the near-term. Immediate resistance is around the 21.30 area. A strong break above this hurdle can take the contract higher to the next targets of 23 and 25.6. Options traders continue to bet on more gains. Hope next week we see breakout.

( click to enlarge )

ACADIA Pharmaceuticals Inc. (NASDAQ:ACAD) looking strong. With more than 25% of the float short, the stock should continue to move higher, despite the fact that it has already enjoyed strong gains. Keep an eye for a possible breakout over 36.88. The rumors about an acquisition are circulating again.

( click to enlarge )

Ocean Power Technologies Inc (NASDAQ:OPTT) has been pulling back on low volume after massive one day rally on Wednesday. As you can see from the 30m chart above, in this corrective phase the stock has found a strong support on its rising 50-day EMA on multiple occasions (yellow line), forming a nice base. With MACD showing signs to enter the positive territory (positive divergence) beyond the centreline, a firm break of $4.08 on the upside would take the stock to the next immediate resistance at $5. A lot of people have shorted this stock over the past 2 sessions (A/D chart still showing accumulation) so we could see shorts pushing OPTT higher.

( click to enlarge )

Put FORM Holdings Corp. Common Stock (NASDAQ:FH) on your agenda next week. The rally into the green late Friday afternoon, tells me that buyers are aware of the potential of this stock on positive news that could come at any time. The company has just under 14M shares in the public float and it could have an impact on upward pricing. OPTT rally last week should be considered as a serious warning for shorts. From a technical standpoint, MACD continues to make higher lows (Positive divergence). This is a clear sign that the bulls are slowly starting to gain momentum over the bears. A trend reversal looks imminent.

( click to enlarge )

Can Fite Biopharma Ltd (NYSEMKT:CANF) price had a nice surge a few weeks ago and has been in a correction mode. The stock is now displaying upside momentum and is poised to move higher from these levels. Nearest resistance for the stock is at $3.10. If this level is crossed and the stock is able to sustain above this level, then it might go to $3.59. Keep an eye on CANF next week.

( click to enlarge )

Whiting Petroleum Corp (NYSE:WLL) is another stock I am watching closely. On the chart above, we can see that the stock is currently trading within an ascending triangle formation and needs to break 13.2 on higher volume to really start moving. Despite recent pullback, the daily RSI remains above 60 levels and may support the bullish argument. Additionally, the MACD still show the stock is on the positive swing. On watch.

( click to enlarge )

Shares of Lion Biotechnologies Inc (NASDAQ:LBIO) soared 43.45% or 28 cents to $8.65 per share on heavy trading volume Friday after announcing a new CEO and raising about $100M in a private offering. It broke out of a major resistance area around 8.40's and it will be very bullish if it can continue to rally next week. Friday's high is immediate resistance on the upside for another fast short squeeze.

( click to enlarge )

The stock price of Arena Pharmaceuticals, Inc. (NASDAQ:ARNA) has recovered smartly since the low of 1.48. It is currently in a short-term uptrend and may move up to 2/2.05 on volume trading. Technical indicators are bullish.

( click to enlarge )

Rambus Inc. (NASDAQ:RMBS) stock seems to have broken out of an inverted Head and SHoulder pattern formation last week. Can get interesting. Keep close eye on this one for a major rally to the upside. Stop 11.72


Just to inform: The Stockal app got nominated as Best In Class among Trade Idea Platforms and Apps at the Benzinga Fintech Awards in New York last week. Here's something about their "Trending Stocks" feed: they take 3 parameters into account - analyst opinion (from top Wall St firms), social media buzz and changes in stock sentiment. Unlike most other platforms where Trending Stocks are decided based on what is being discussed most, Stockal helps discover 20 stocks every few minutes on the basis of these 3 parameters together. What this does is that the stocks that emerge have a higher probability of price movements. Many people say they have come across stocks, on Stockal, that they would have otherwise not paid attention to. So give Stockal the app a spin and say if it helped you discover some interesting stocks (that moved). Here's a link to their iOS app and their Android app . By the way, the apps are totally FREE for my readers.

Disclaimer : This is not an investment advisory, and should not be used to make investment decisions. Information in AC Investor Blog is often opinionated and should be considered for information purposes only. No stock exchange anywhere has approved or disapproved of the information contained herein. There is no express or implied solicitation to buy or sell securities. The charts provided here are not meant for investment purposes and only serve as technical examples. Don't consider buying or selling any stock without conducting your own due diligence.

Thanks for visiting AC Investor Blog.

AC

Labels: , , , , , , , ,

Bookmark and Share

Wednesday, April 13, 2016 

Stocks to Watch for April 14, 2016

( click to enlarge )

ACADIA Pharmaceuticals Inc. (NASDAQ:ACAD) is still trading around the $33 level which has been a strong resistance over the past several days. I now plan to buy the stock again if it can break Thursday's high of $34.06.

( click to enlarge )

Achillion Pharmaceuticals, Inc. (NASDAQ:ACHN) broke out from its sideways consolidation with a 3% rally and closed over the resistance area of 8.30. Keep this one on your radar over the next days.

( click to enlarge )

GoPro Inc (NASDAQ:GPRO) broke out above its declining 50-day EMA today and surged considerably higher amidst impressive buying pressure. It is getting some buying and looks poised to post some nice gains if the buying volume persists. I expect the stock to continue to gain investor interest going forward. Keep it on your watch list.

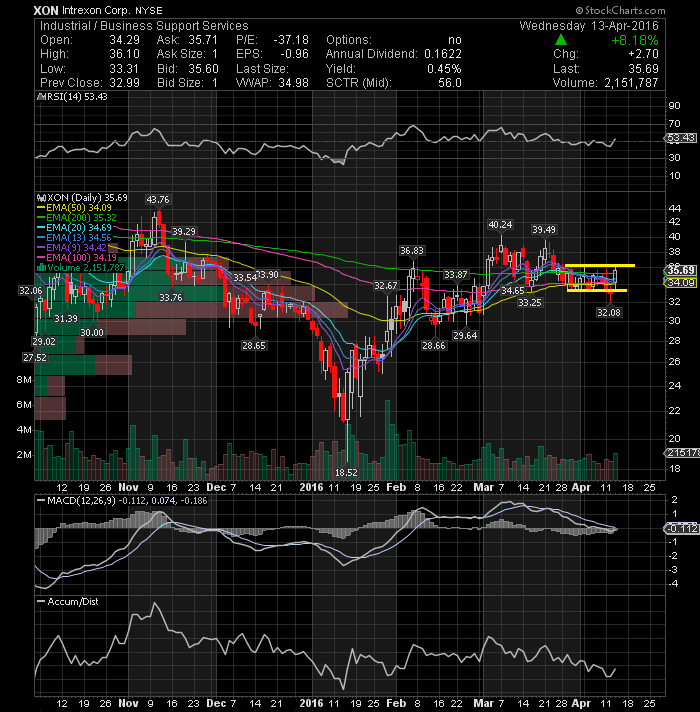
( click to enlarge )

Intrexon Corp (NYSE:XON) Price should become explosive if this daily chart pattern is broken to the upside with volume.

( click to enlarge )

BioMarin Pharmaceutical Inc. (NASDAQ:BMRN) is building an optimistic pattern under resistance at $91. Watch the stock closely for a break through that price level as a cue that the stock wants to go higher. Initial support at $85

( click to enlarge )

Gogo Inc (NASDAQ:GOGO) showed some nice strength today. The stock closed nicely above the major short-term MA levels with solid volume. Keep an eye for a possible breakout over 11.32

( click to enlarge )

Vringo, Inc. (NASDAQ:VRNG) There is a positive MACD divergence on the daily technical chart and this usually means that an upward movement is coming. Wednesday’s high was $1.95, which is resistance for the continuation move. There is a lot of upside in this trade, so keep this stock on your screen tomorrow.

If you want to contact me for advertising opportunities on blog or twitter, then get in touch via email

Disclaimer : This is not an investment advisory, and should not be used to make investment decisions. Information in AC Investor Blog is often opinionated and should be considered for information purposes only. No stock exchange anywhere has approved or disapproved of the information contained herein. There is no express or implied solicitation to buy or sell securities. The charts provided here are not meant for investment purposes and only serve as technical examples. Don't consider buying or selling any stock without conducting your own due diligence.

Thanks for visiting AC Investor Blog.

AC

Labels: , , , , , ,

Bookmark and Share

Wednesday, May 27, 2015 

Stocks to keep an eye on May 28, 2015

( click to enlarge )

FibroGen Inc (NASDAQ:FGEN) broke out of the bottom base formation accompanied by strong volume. This could be the start of a nice bounce and the extreme oversold conditions will also help. As i said on twitter, i went long. Watch for a continuation move tomorrow. If it breaks above 19.19 (9EMA), it could reach an initial target of 20.04 and then a secondary target at 21

( click to enlarge )

Himax Technologies, Inc. (NASDAQ:HIMX) finished near its highs and has closed again above the 50-day exponential moving average. So, tomorrow keep an eye on the stock for a possible breakout over $6.70 on a close basis.

( click to enlarge )

ACADIA Pharmaceuticals Inc. (NASDAQ:ACAD) On radar. I like over 40.99 for a trade. 13EMA is support.

( click to enlarge )

Agenus Inc (NASDAQ:AGEN) Strong move today on solid volume. Traders should watch for a potential breakout over 8. The MACD is positive and above its rising signal line. A breakout above the key resistance could take the stock much higher as the daily chart shows little resistance.

( click to enlarge )

Ariad Pharmaceuticals, Inc. (NASDAQ:ARIA) Basing here. Over $9.25 would be buy trigger. As long as the stock holds above the 50-day EMA support line the short-term picture should remain positive.


Disclaimer : This is not an investment advisory, and should not be used to make investment decisions. Information in AC Investor Blog is often opinionated and should be considered for information purposes only. No stock exchange anywhere has approved or disapproved of the information contained herein. There is no express or implied solicitation to buy or sell securities. The charts provided here are not meant for investment purposes and only serve as technical examples. Don't consider buying or selling any stock without conducting your own due diligence.

Thanks for visiting AC Investor Blog.

AC

Labels: , , , ,

Bookmark and Share

Wednesday, July 31, 2013 

Stocks to Watch for August 1, 2013

( click to enlarge )

YRC Worldwide, Inc. (NASDAQ:YRCW) Nice jump out of the bull flag today. Technicals look good. Watch for a good follow through day. 

( click to enlarge )

Phillips 66 (NYSE:PSX) Big bullish engulfing candle on expanding volume today. Looking good to go higher. Wednesday’s high of $61.97 is resistance for the next upside move. If the stock can break through this level, we should see a strong move. PSX can be a good trading stock, so keep it on your radar for the next few days.

( click to enlarge )

Tesla Motors Inc (NASDAQ:TSLA) As long as the stock holds above the $122.83 support level the intermediate-term picture should remain positive. Fresh exposures may be considered on a move past $137.49, with a stop-loss at $128.20.

( click to enlarge )

Canadian Solar Inc. (NASDAQ:CSIQ) Breaking out to the upside from its recent consolidation. This one looks like it wants higher to me. Stop 12.99

( click to enlarge )

Facebook Inc (NASDAQ:FB) As expected the stock pulled back after a strong move to new highs. I think it needs to work its overbought conditions, before start a new rally.

( click to enlarge )

ACADIA Pharmaceuticals Inc. (NASDAQ:ACAD) Stalking. Consolidation at highs continues, 20,68 resistance higher, support at 18.47 and 17.45 below.

During the day I tweet many times to my readers. I encourage everybody to subscribe AC Investor Blog  twitter and newsletter, so you can receive my trade ideas and stock news in real time.  

Disclaimer : This is not an investment advisory, and should not be used to make investment decisions. Information in AC Investor Blog is often opinionated and should be considered for information purposes only. No stock exchange anywhere has approved or disapproved of the information contained herein. There is no express or implied solicitation to buy or sell securities. The charts provided here are not meant for investment purposes and only serve as technical examples. Don't consider buying or selling any stock without conducting your own due diligence.

Thanks for visiting AC Investor Blog.

AC

Labels: , , , , ,

Bookmark and Share

Monday, July 29, 2013 

Stocks to Watch for July 30, 2013

( click to enlarge )

Bullish signal on increased volume. ACADIA Pharmaceuticals Inc. (NASDAQ:ACAD) can potentially set-up very well for a swing-trade if it breaks through the resistance level at $20.68. There could be good upside in this trade, so watch the stock closely tomorrow.

( click to enlarge )

Intrepid Potash, Inc. (NYSE:IPI) is on my watch list. The EMA200 at 19.77 is pretty much the pivot here. If that breaks, we could see 20.5 quickly. From a technical standpoint, the chart looks positive as 20-day exp moving average has just crossed on top of 50-day exp moving average. Lets keep an eye on it.

( click to enlarge )

Strong day in down market. Agrium Inc. (USA) (NYSE:AGU) needs to take out $93.67 (EMA200). The break of the resistance line with heavy volume should be the next buy point on AGU.

( click to enlarge )

Himax Technologies, Inc. (NASDAQ:HIMX) Stalking. The stock is forming a likely Cup & Handle pattern with breakout area around 7.85

During the day I tweet many times to my readers. I encourage everybody to subscribe AC Investor Blog  twitter and newsletter, so you can receive my trade ideas and stock news in real time.  

Disclaimer : This is not an investment advisory, and should not be used to make investment decisions. Information in AC Investor Blog is often opinionated and should be considered for information purposes only. No stock exchange anywhere has approved or disapproved of the information contained herein. There is no express or implied solicitation to buy or sell securities. The charts provided here are not meant for investment purposes and only serve as technical examples. Don't consider buying or selling any stock without conducting your own due diligence.

Thanks for visiting AC Investor Blog.

AC

Labels: , , ,

Bookmark and Share
Contact

About Me

    Photobucket
  • I'm a 48 year old Independent Trader using proprietary technical analysis with more than 20 years experience of investing in the US stock markets. I started this blog in 2006 simply as a way to share my thoughts about capital, risk management, and trading. My blog contains only my personal opinion and is provided for informational purposes only.

  • Benzinga.com supporter

    Benzinga.com supporter


    FREE NEWSLETTER

      Enter your email address:

      Delivered by FeedBurner

      Subscribe my feed :

    Support AC

    • Support AC Investor Blog, Donate with PayPal

    Advertising

      Interested in advertising on AC Investor Blog ? Click Here

    TRANSLATOR

    Site Information

    Stock Market Blogroll

    Friends BLOGROLL

    ARCHIVES

Powered by Blogger
and Blogger Templates


Add to Google