-Financial Tools Futures Market--TRADE IDEAS-- OPTION ALERTS -BENZINGA PRO-

Thursday, May 18, 2017 

My Watchlist for Friday, May 19

( click to enlarge )

HTG Molecular Diagnostics Inc (NASDAQ:HTGM) has been in a major corrective phase in the recent weeks forming a large falling wedge that was broken to the upside. The downtrend that commenced in late March appears to have been completed and MACD is about to climb above the signal line. If it clears resistance around the 3.9-4 area the move may be powerful.

( click to enlarge )

Inpixon (NASDAQ:INPX) appears to be poised for a nice bounce off this bottom. From my point of view, the stock has formed a bottom and I expect a move past 2.60 to take the stock towards the target of 3.24. The Accumulation/distribution line shows lots of accumulation.

( click to enlarge )

Achillion Pharmaceuticals, Inc. (NASDAQ:ACHN) I will be watching the stock tomorrow for a continuation move through Thursday’s highs of $4.48. The CMF indicator on chart shows the strength of conviction behind this Bullish trend. Lets keep an eye on it.

( click to enlarge )

athenahealth, Inc (NASDAQ:ATHN) Nice breakout on high volume. There is a good chance the stock will continue to move up. Next resistance lies at 132.84

( click to enlarge )

Proteostasis Therapeutics Inc (NASDAQ:PTI) Strong bullish candle on decent volume. Watch tomorrow for a follow-through day. Next resistance lies at 5.38 followed by 6.75

( click to enlarge )

Catalyst Pharmaceuticals Inc (NASDAQ:CPRX) had a nice move, as the stock set new 52-week highs. The stock hit a high of $2.27, which is resistance for the follow through move. Charts on all time frames are bullish.

If you want to contact me for advertising opportunities on blog or twitter, then get in touch via email

Disclaimer : This is not an investment advisory, and should not be used to make investment decisions. Information in AC Investor Blog is often opinionated and should be considered for information purposes only. No stock exchange anywhere has approved or disapproved of the information contained herein. There is no express or implied solicitation to buy or sell securities. The charts provided here are not meant for investment purposes and only serve as technical examples. Don't consider buying or selling any stock without conducting your own due diligence.

Thanks for visiting AC Investor Blog.

AC

Labels: , , , , ,

Bookmark and Share

Monday, August 22, 2016 

My Watchlist for Tuesday, August 23

( click to enlarge )

Amedica Corporation (NASDAQ:AMDA) broke out into the gap area on heavy volume and there is a high probability for a trend continuation in the next sessions (closing gap). Daily technical indicators are showing signs of turning around.

( click to enlarge )

Chimerix Inc (NASDAQ:CMRX) displayed some impressive relative strength today with a 9% gain on volume above average. I think we will see some nice follow through tomorrow. The next major resistance area is around the $5 level. Could be a high flyer on breakout.

( click to enlarge )

If you like trading under cash small bio caps, check out this stock: Carbylan Therapeutics Inc (NASDAQ:CBYL). The company has $1.33 per share in cash but trades at 57c. From a technical standpoint, if the stock can break out above the 60c level with heavy volume, I think the stock could shoot up to test 70c area. There looks to be good upside potential, so watch the stock very closely on Tuesday. I started a position today.

( click to enlarge )

Glu Mobile Inc. (NASDAQ:GLUU) possibly basing for breakout. With the daily momentum indicators showing positive divergences on daily chart, I think a push to $2.5 or better could be in the making. Today's high volume could be a signal for trend change and the beginning of a potential major move higher.

( click to enlarge )

Achillion Pharmaceuticals, Inc. (NASDAQ:ACHN) could move toward 10 area if it breaks current horizontal resistance at 9.36

( click to enlarge )

Cesca Therapeutics Inc (NASDAQ:KOOL) was on my bottom scan at $4 on Friday and hit a high of $4.92 today. A good example of why bottom plays can be very lucrative, if you buy in at the right time. On the upside, I expect tough resistance at $5

( click to enlarge )

Ocean Power Technologies Inc (NASDAQ:OPTT) stock has been consolidating in recent weeks and is currently trading sideways.Watch for a possible breakout out of current consolidation (symmetrical triangle).

If you want to contact me for advertising opportunities on blog or twitter, then get in touch via email

Disclaimer : This is not an investment advisory, and should not be used to make investment decisions. Information in AC Investor Blog is often opinionated and should be considered for information purposes only. No stock exchange anywhere has approved or disapproved of the information contained herein. There is no express or implied solicitation to buy or sell securities. The charts provided here are not meant for investment purposes and only serve as technical examples. Don't consider buying or selling any stock without conducting your own due diligence.

Thanks for visiting AC Investor Blog.

AC

Labels: , , , , , ,

Bookmark and Share

Wednesday, April 13, 2016 

Stocks to Watch for April 14, 2016

( click to enlarge )

ACADIA Pharmaceuticals Inc. (NASDAQ:ACAD) is still trading around the $33 level which has been a strong resistance over the past several days. I now plan to buy the stock again if it can break Thursday's high of $34.06.

( click to enlarge )

Achillion Pharmaceuticals, Inc. (NASDAQ:ACHN) broke out from its sideways consolidation with a 3% rally and closed over the resistance area of 8.30. Keep this one on your radar over the next days.

( click to enlarge )

GoPro Inc (NASDAQ:GPRO) broke out above its declining 50-day EMA today and surged considerably higher amidst impressive buying pressure. It is getting some buying and looks poised to post some nice gains if the buying volume persists. I expect the stock to continue to gain investor interest going forward. Keep it on your watch list.

( click to enlarge )

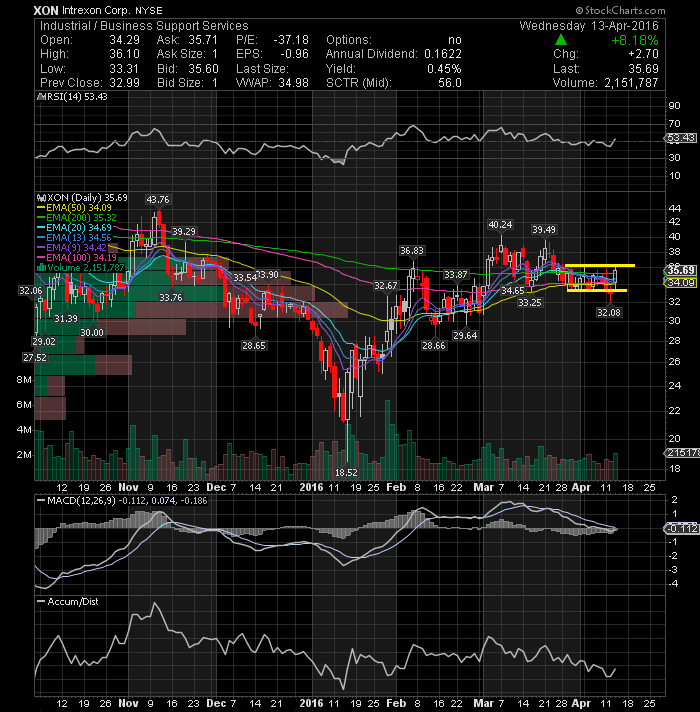
Intrexon Corp (NYSE:XON) Price should become explosive if this daily chart pattern is broken to the upside with volume.

( click to enlarge )

BioMarin Pharmaceutical Inc. (NASDAQ:BMRN) is building an optimistic pattern under resistance at $91. Watch the stock closely for a break through that price level as a cue that the stock wants to go higher. Initial support at $85

( click to enlarge )

Gogo Inc (NASDAQ:GOGO) showed some nice strength today. The stock closed nicely above the major short-term MA levels with solid volume. Keep an eye for a possible breakout over 11.32

( click to enlarge )

Vringo, Inc. (NASDAQ:VRNG) There is a positive MACD divergence on the daily technical chart and this usually means that an upward movement is coming. Wednesday’s high was $1.95, which is resistance for the continuation move. There is a lot of upside in this trade, so keep this stock on your screen tomorrow.

If you want to contact me for advertising opportunities on blog or twitter, then get in touch via email

Disclaimer : This is not an investment advisory, and should not be used to make investment decisions. Information in AC Investor Blog is often opinionated and should be considered for information purposes only. No stock exchange anywhere has approved or disapproved of the information contained herein. There is no express or implied solicitation to buy or sell securities. The charts provided here are not meant for investment purposes and only serve as technical examples. Don't consider buying or selling any stock without conducting your own due diligence.

Thanks for visiting AC Investor Blog.

AC

Labels: , , , , , ,

Bookmark and Share

Saturday, January 02, 2016 

Chart setups for the first trading week of the year

( click to enlarge )

With Chimerix Inc (NASDAQ:CMRX) still trading within the gap, I expect to see a continuation of the bounce next week. I like when insiders are buying back shares and last week they bought 125000, which is a clear indication that the top executives are seeing something positive going on. In addition the institutions are also bullish, according to a new 13G filing, Point72 Asset Management has initiated a 5.3% stake in the company. The combination of the insider and instituions activity and the extreme oversold readings, makes me think that the bounce/rally should continue for a few more days. Keep watching the stock.

( click to enlarge )

I'm putting Lion Biotechnologies Inc (NASDAQ:LBIO) back on the list for another week. After making a big move in November, the stock has been in a consolidation mode and I feel it is going to make another upside move very soon. The volume has been quite modest and the MACD seems to be stabilizing (MACD histogram is now showing a pos divergence), which could power the rally that I think is coming. Additionally, the stock is still trading above its medium term EMAs with RSI also in the Bullish territory. If it breaks above 7.88 (200-day EMA), further up move can be expected. This is a fast moving stock, so watch it closely but use your stops if it fails on the breakout. Im long.

( click to enlarge )

BlackBerry Ltd (NASDAQ:BBRY) is flagging after a sharp move from 8 to 9.46 in the third week of December. A break of 9.46 resistance could get the stock to targets at 10 and then 10.50 Daily technical indicators are looking bullish. MACD is above its signal line in positive territory and RSI is alternately moving in and out of its overbought zone. Option traders are betting that the stock will keep ripping higher. Hold or use dips to accumulate.

( click to enlarge )

Achillion Pharmaceuticals, Inc. (NASDAQ:ACHN) stock continues to perform strongly and appears poised to breakout to higher levels. On the technical side, the daily chart looks very good. The MACD is positive and above its rising signal line. All EMAs are rising with the stock trading above them. Breakout watch over 10.95

( click to enlarge )

Vical Incorporated (NASDAQ:VICL) has had a hard time with this resistance line (EMA50) but may be ready to move higher. It would need to close above that level to run to 60c. Accumulation line is starting to point up and the RSI is also moving higher, which is a sign of growing strength in the stock. Also the MACD is giving a positive indication. VICL will move quickly, so keep it on your screen on Monday.

( click to enlarge )

NuStar Energy L.P. (NYSE:NS) The stock is on the verge of breaking out and it could happen very soon. If it breaks the 41 level the stock will absolutely fly into the 44's right away. Daily technical indicators are looking bullish. The MACD is rising above its signal line near the positive territory and RSI bounced up again from its 50% level. On watch.

( click to enlarge )

Twitter Inc (NYSE:TWTR) Nice Bullish Engulfing candle on higher volume. The stock is nearing a key resistance level of 23.54, which if broken should lead to a target of $25 in the short term. Price broke through its 13-day EMA resistance on Thursday session but failed to close above, however this was the first signal that I was looking for since a while. I'm using $23.54 as resistance for this upside move. If the stock can break through this level we should see a reversal of this down trend.

Disclaimer : This is not an investment advisory, and should not be used to make investment decisions. Information in AC Investor Blog is often opinionated and should be considered for information purposes only. No stock exchange anywhere has approved or disapproved of the information contained herein. There is no express or implied solicitation to buy or sell securities. The charts provided here are not meant for investment purposes and only serve as technical examples. Don't consider buying or selling any stock without conducting your own due diligence.

Thanks for visiting AC Investor Blog.

AC

Labels: , , , , , ,

Bookmark and Share

Saturday, May 30, 2015 

Stocks to keep an eye on June 01, 2015

( click to enlarge )

The daily technical chart pattern of ZIOPHARM Oncology Inc. (NASDAQ:ZIOP) has been consolidating within a falling wedge pattern that has bullish implications. A breakout is needed to end this large consolidation and resume the uptrend. At this point Im inclined to mark a key resistance zone around 10-10.2. A move above this area, would break the upper trendline and the resistance zone. If a breakout occurs, we could see an acceleration of the bullish momentum and move toward the 11.50-12.13 area. Daily technical indicators are looking bullish, MACD and RSI are showing upward momentum. On watch.

( click to enlarge )

ITT Educational Services, Inc.(NYSE:ESI) surged 81% on Friday on one of the heaviest volume sessions this year, with 11.7 million shares traded. That is nearly 11x the average. Let's keep things simple as always! Could history repeat itself ? After looking at this daily technical chart and reviewing the price action, I came to the conclusion that we could see a surge like the one on the chart from mid-October of 2014. The small float and the high short interest could fuel another massive spike higher once the 50-day EMA is taken out to the upside. RSI has lot of room and MACD is crossing up.

( click to enlarge )

Celladon Corp (NASDAQ:CLDN) The rally in the price has broken the downtrend line on Friday, which is a buy signal. The stock could see now a significant bounce from this level. On the technical side, MACD and Slow Sto all point to upward trend while RSI is trying to break above its 30% level, passing into neutral territory. Plus, the stock broke through its 9-day EMA for the first time since April and should continue to move. CLDN has a lot of upside potential, so watch it closely on Monday.

( click to enlarge )

Sprint Corp (NYSE:S) is showing signs of a potential upside recovery. Daily MACD has stabilized and is about to cross over its signal line. A crossover would be nice and bullish. The June $5 call options have been active. Next week watch the resistance at 4.77. A close above will be bullish and may test 4.88/4.95.

( click to enlarge )

Microsoft Corporation (NASDAQ:MSFT) has been consolidating in a bullish pennant over the last five weeks. Play the break of the pattern.

( click to enlarge )

Achillion Pharmaceuticals, Inc. (NASDAQ:ACHN) has gained momentum recently and the stock rebounded about 10% in the past couple of trading sessions on increased volume. On Friday, the stock closed near its critical breakout point of $10, which may be broken out next week. Looking at the daily technical chart the MACD momentum is rising and RSI is on a strong uptrend, which when combined with the strengthening MACD could spell a strong move for the stock. If it crosses the $10 level, the stock has potential to gain 10-12%.

( click to enlarge )

CTI BioPharma Corp (NASDAQ:CTIC) could be in the early stages of a technical breakout. Technicals are showing bullish signals supported by rising MACD, ADX and RSI on the daily charts. For now, expect a run up to next resistance area around $2. If the stock is able to cross it and sustain above it, then it might go to $2.40. Keep it on your watch list going forward.

( click to enlarge )

I continue to support the idea of a significant rally on shares of Oasis Petroleum Inc. (NYSE:OAS), probably even above the February highs. The bulls remain in control as long as it continues consolidating its recent move. We still need to see a break and close above 17.83 or 100EMA to confirm a continuation to the upside with a next target in the 20 area. Only a break back below the 15 would invalidate this bullish outlook.

Have a fantastic weekend.

Disclaimer : This is not an investment advisory, and should not be used to make investment decisions. Information in AC Investor Blog is often opinionated and should be considered for information purposes only. No stock exchange anywhere has approved or disapproved of the information contained herein. There is no express or implied solicitation to buy or sell securities. The charts provided here are not meant for investment purposes and only serve as technical examples. Don't consider buying or selling any stock without conducting your own due diligence.

Thanks for visiting AC Investor Blog.

AC

Labels: , , , , , , ,

Bookmark and Share

Saturday, January 10, 2015 

Stocks to keep an eye on January 12, 2015

( click to enlarge )

Twitter Inc (NYSE:TWTR) attempted to push lower in the last trading session, slipped below 38.5 but closed the day higher at 40.17 on decent volume, above the major horizontal resistance line and the 50-day EMA for the first time since October 2014, as you can see on my daily chart. This fact confirms and keeps the bullish scenario intact. I think we could still see further upside attempts next week re-testing the 42 resistance area. Further, the MACD still rising and the RSI remains above 50 levels, suggesting continuation of the uptrend on the daily charts.

( click to enlarge )

Arena Pharmaceuticals, Inc.(NASDAQ:ARNA) is pulling back after a strong rally and could form a bull flag pattern. The stock will probably need a rest here to clear the overbought conditions before making any further moves higher but the daily the momentum continues strong.

( click to enlarge )

Achillion Pharmaceuticals, Inc. (NASDAQ:ACHN) made a bit more progress to the upside on Friday by breaking a key resistance level built up last week and may still have a chance to run from here. It is likely to show further up side if the stock succeeds in convincingly breaching the resistance at 15 levels.

( click to enlarge )

Oasis Petroleum Inc. (NYSE:OAS) remains in this channel base pattern on hourly. This channel needs to be broken for a decisive move on either side. The positive divergences on momentum indicators chart support the bullish case. Institutions and insiders are adding positions. I'm long.

( click to enlarge )

Baytex Energy Corp (NYSE:BTE) On the hourly time frame, this Oil name also remains in a short-term sideways trend with positive divergence on oscilators, which means it could be basing for a move to the upside. Clear break above 14.89/15 area could trigger further bullish recovery testing 16.20. Immediate support at 14.32 followed by 14.01.

( click to enlarge )

Sunesis Pharmaceuticals, Inc. (NASDAQ:SNSS) tried to break out on Friday but did not have enough strenght to move forward, caution is best right here. A long entry could potentially be made at 3.

During the day I tweet many times to my readers. I encourage everybody to subscribe AC Investor Blog twitter and newsletter, so you can receive my trade ideas and stock news in real time.

Disclaimer : This is not an investment advisory, and should not be used to make investment decisions. Information in AC Investor Blog is often opinionated and should be considered for information purposes only. No stock exchange anywhere has approved or disapproved of the information contained herein. There is no express or implied solicitation to buy or sell securities. The charts provided here are not meant for investment purposes and only serve as technical examples. Don't consider buying or selling any stock without conducting your own due diligence.

Thanks for visiting AC Investor Blog.

AC

Labels: , , , ,

Bookmark and Share

Saturday, January 03, 2015 

7 stocks to keep an eye on January 5, 2015

( click to enlarge )

Celldex Therapeutics, Inc. (NASDAQ:CLDX) has pulled back after hitting a six-month high six weeks ago, but could soon be poised to retest those highs. On the updated daily chart above, the stock is flagging just above its major short-term moving averages, while MACD is starting to provide positive signs. As long as the stock trades above its EMAs, the outlook will remain bullish. The key immediate resistances at 18.85 and 19.45 have to be broken decisively next week, for an up move to 20.25 and then to 21.7 levels in the short-term. At the moment my bullish bias remains intact.

( click to enlarge )

Seadrill Ltd (NYSE:SDRL) The stock shows a potential bottom formation here that could be completed in the next week. There is minor resistance now at $12.23 with stronger resistance in the $12.86 area. The CMF has also risen sharply over the past two weeks, showing increasing buying pressure.

( click to enlarge )

Viggle Inc (NASDAQ:VGGL) has started the month of January with a strong rally of nearly 26%. The stock broke its downtrend line on heavy volume and closed above its short-term EMAs. Go long on the break of Friday’s high at 3.55 with a tight stop. Expect next major resistance around $4

( click to enlarge )

Skyworks Solutions Inc (NASDAQ:SWKS) The stock continues to retest major resistance around its recent highs and could be poised for a breakout to new record highs.

( click to enlarge )

Achillion Pharmaceuticals, Inc. (NASDAQ:ACHN) continues to trade above its key 100-day exponential moving average showing some strength, despite a pullback from its record highs. Go long on the break Friday’s candle high with a stop-loss behind the swing low at 12.33

( click to enlarge )

VirnetX Holding Corporation (NYSEMKT:VHC) On the hourly time frame, the stock continues to trade sideways around its 50EMA but has established strong support around 5.20. In addition, the stock closed the week breaking above the bullish flag as you can see on the chart above, confirming the bullish scenario targeting the 6.85 area. I remain bullish.

( click to enlarge )

Synergy Pharmaceuticals Inc (NASDAQ:SGYP) recently hit a short-term high at 3.41 before pulling back slightly and the stock appears poised to continue its bullish run. I think higher, but still in wait and see mode. The stock needs to close above the 100-day exponential moving average before the medium-term view turns positive. Long set-up on watch.

During the day I tweet many times to my readers. I encourage everybody to subscribe AC Investor Blog twitter and newsletter, so you can receive my trade ideas and stock news in real time.

Disclaimer : This is not an investment advisory, and should not be used to make investment decisions. Information in AC Investor Blog is often opinionated and should be considered for information purposes only. No stock exchange anywhere has approved or disapproved of the information contained herein. There is no express or implied solicitation to buy or sell securities. The charts provided here are not meant for investment purposes and only serve as technical examples. Don't consider buying or selling any stock without conducting your own due diligence.

Thanks for visiting AC Investor Blog.

AC

Labels: , , , , , ,

Bookmark and Share

Monday, March 24, 2014 

Stocks to Watch for March 25, 2014

( click to enlarge )

Achillion Pharmaceuticals, Inc. (NASDAQ:ACHN) is close to a break out above $3.71. The stock price action has remained under its daily 100-day exp moving average for some time, however a rising daily MACD momentum has begun a bullish divergence, suggestive of a price reversal at these price levels. A break above $3.71 would be bullish. Maxim Group upgraded the stock from Hold to Buy with a price target of $6. Let's keep an eye on it.

( click to enlarge )

Westar Energy Inc (NYSE:WR) good relative strength compared to the market today. The stock looks poised to clear this major resistance area. Keep on watch for the break on volume and go long.

( click to enlarge )

InterDigital, Inc. (NASDAQ:IDCC) is displaying upside momentum on chart and looks poised to move higher from these levels. Expect an initial run up to its 200-day exp moving average at $33.71.

( click to enlarge )

KCAP Financial Inc (NASDAQ:KCAP) has been consolidating in a tight range for the past six weeks just above its 50-day exp moving average. Volume is starting to build and it may attempt to break out over the 200-day exp moving average. Let's keep an eye on it.

During the day I tweet many times to my readers. I encourage everybody to subscribe AC Investor Blog twitter and newsletter, so you can receive my trade ideas and stock news in real time.

Disclaimer : This is not an investment advisory, and should not be used to make investment decisions. Information in AC Investor Blog is often opinionated and should be considered for information purposes only. No stock exchange anywhere has approved or disapproved of the information contained herein. There is no express or implied solicitation to buy or sell securities. The charts provided here are not meant for investment purposes and only serve as technical examples. Don't consider buying or selling any stock without conducting your own due diligence.

Thanks for visiting AC Investor Blog.

AC

Labels: , , ,

Bookmark and Share
Contact

About Me

    Photobucket
  • I'm a 48 year old Independent Trader using proprietary technical analysis with more than 20 years experience of investing in the US stock markets. I started this blog in 2006 simply as a way to share my thoughts about capital, risk management, and trading. My blog contains only my personal opinion and is provided for informational purposes only.

  • Benzinga.com supporter

    Benzinga.com supporter


    FREE NEWSLETTER

      Enter your email address:

      Delivered by FeedBurner

      Subscribe my feed :

    Support AC

    • Support AC Investor Blog, Donate with PayPal

    Advertising

      Interested in advertising on AC Investor Blog ? Click Here

    TRANSLATOR

    Site Information

    Stock Market Blogroll

    Friends BLOGROLL

    ARCHIVES

Powered by Blogger
and Blogger Templates


Add to Google