The area of previous support of RIMM around $97, now becomes resistance. If the resistance holds, then it signals an intermediate to short term trend change. In this case it rose and quickly fell away from resistance, but if resistance is broken, then expects a move to $110.
RMBS looks to be stabilizing at the 200 dma and trendline. A Breakout from $18.75 and a new rally should follow.

Chart courtesy of
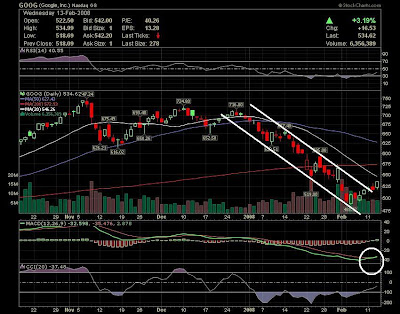
stockchartsGoogle may find some resistance to break above its 20-day moving average at $546, however stock is now gaining a Bullish momentum after it has been broken over this week the descending channel.
FSLR broke the ascending triangle pattern with Bullish spike in volume. The trend is now in favour of Bulls. Stock has now room to go higher. MACD and RSI both in Bullish areas.
LDK has closed the day above its downtrend line but far from the highs of the day. So, wait for tomorrow confirmation before entry long at this level. A confirmation with volume should result in a continued upside to test its strong first resistance at $40.
Disclaimer : Trading stocks involves risk, this information should not be viewed as trading recommendations.The charts provided here are not meant for investment purposes and only serve as technical examples.
That's All. Have a nice evening !!!
AC
Labels: FSLR, GOOG, LDK, RIMM, RMBS
 Chart courtesy of stockcharts
 Chart courtesy of stockcharts


Hey Sir,
You have a fantastic blog with short and conclusive analyzes. Congrats !!
From now on, you'll have a new reader.
Tom Smith
Posted by Anonymous |
7:56 AM