Time for a rebound !! Stocks in oversold conditions....
 Chart courtesy of stockcharts.com
Oil prices fell on Friday after Iran's minister to OPEC said the group was not likely to cut production at its June meeting despite signs of surplus supply in the market, this news push the crude Oil until the bottom of the channel formed since April.
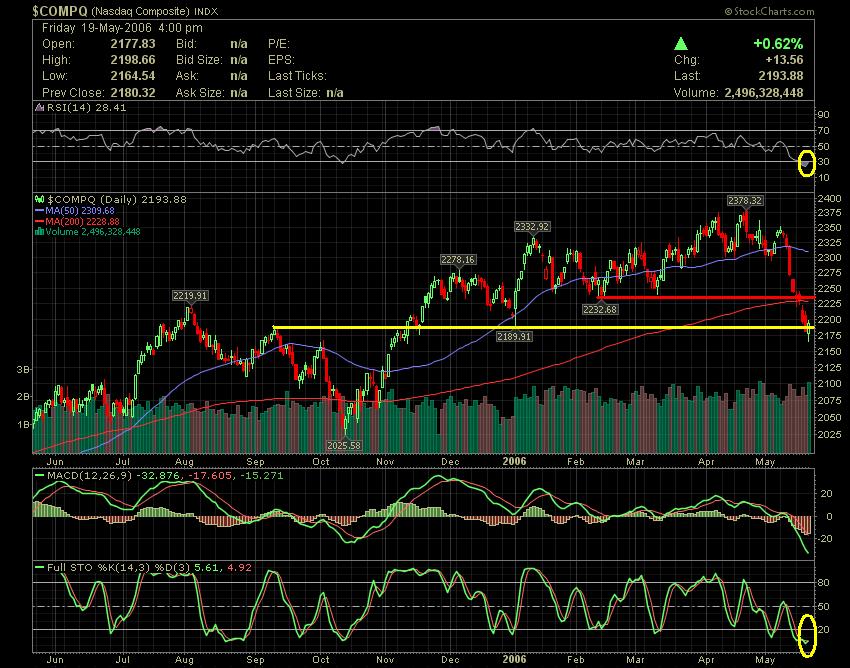 Chart courtesy of stockcharts.com
During this week we attended a big losses around the world in some markets of reference, some of these losses exceeded 5% on only one week. The reference aupports was broken very easy without any kind of indecisions, so next week can be a week of volatility and reflection face this wave of instability, and I think that the markets can rebound from these levels, however ba carefull. The last session of Nasdaq did a white candle with a good volume showed some strength at the end of session, so we can see some light in the tunel perhaps the red line resistance "MM200".
 Chart courtesy of stockcharts.com
JDSU has held above the red line MM200 as a support, also the Oversold conditions doesn't have pressured the stock to break the mm200, so we can have some rebound from this levels perhaps until the next resistance at 2.96.
 Chart courtesy of stockcharts.com
SWKS Looks like it started to get a technical bounce on Friday after having fallen 10 consecutive sessions. According to chart above we can see that the stock is now trying to leave of Oversold conditions.
Resistance : $5.95
Supports : $ 5.75 and $5.66
Resistance : $5.95
Supports : $ 5.75 and $5.66
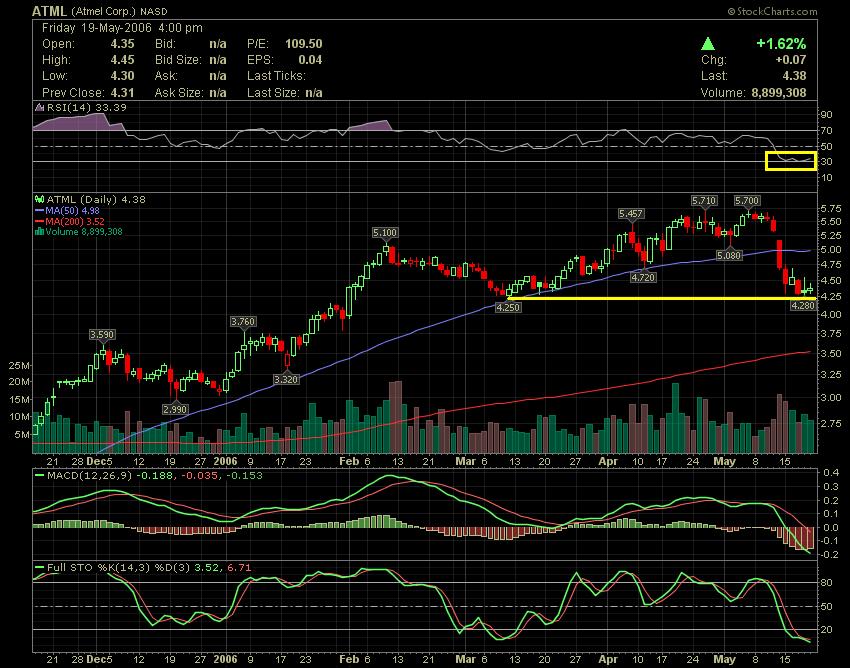 Chart courtesy of stockcharts.com
ATML looks like it may get a bounce here after tested the support 4.25 with success , also the recent clandlestick analysis show a Bullish signal.
First resistance : $4.40 next resistance $4.85
First Support : $4.25 next $3.70
That's All. Have a great weekend and a good business week.
AC
First resistance : $4.40 next resistance $4.85
First Support : $4.25 next $3.70
That's All. Have a great weekend and a good business week.
AC


