Bad week for mostly stocks " Bears on the table"
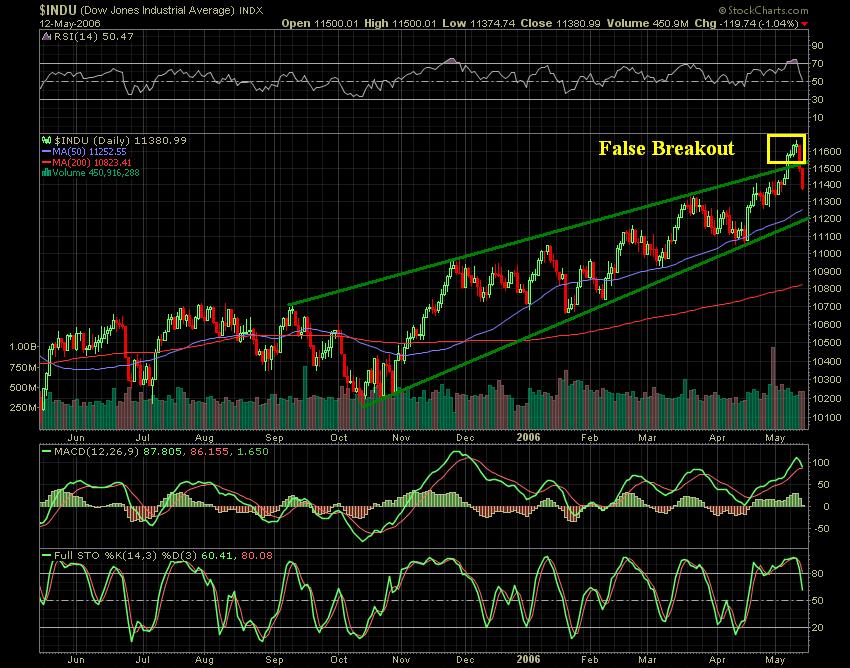 Chart courtesy of stockcharts
U.S. stocks closed lower on the day and week Friday, with the Nasdaq Composite at its weakest level since mid-February. The Dow Jones Industrial closed down 119.74 points to 11.380 and the Nasdaq Composite Index fell 28.92 points to 2,243.78, it weakest close since February 13.
I have focused in the last post the fact that the dowjones breakout LT was done with a small volume and the volume have decreased session after saession before the breakout, also I mentioned the fact of the Overbought conditions that the market have reached, so all these factors together ( not only ) have contribuied for the recent Sell Off also linked to the inflation fears.
Macro economic news reported on Friday :
- The Labor Departement said U.S. import prices jumped by 2.1 % in April. The increase resulted from the biggest jump in imported petroleum costs in more thatn a year.
- The Preliminnary May consumer sentiment fall to 79 from 87.4 in prior month.
- U.S. trade deficit narrowed unexpectedly to $62 billion in March from $65.64 billion in the prior month.
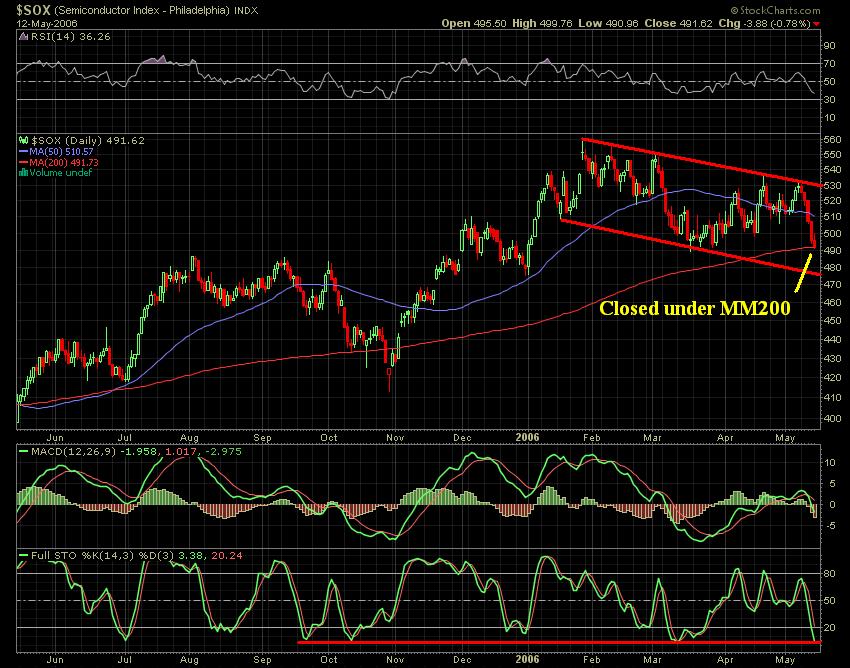 Chart courtesy of stockcharts
The Philadelphia semicondutor index closed the week under the support of its MM200 and during the friday session showed some resistance to break this line, this could be a strenght for Bulls for the week ahead.
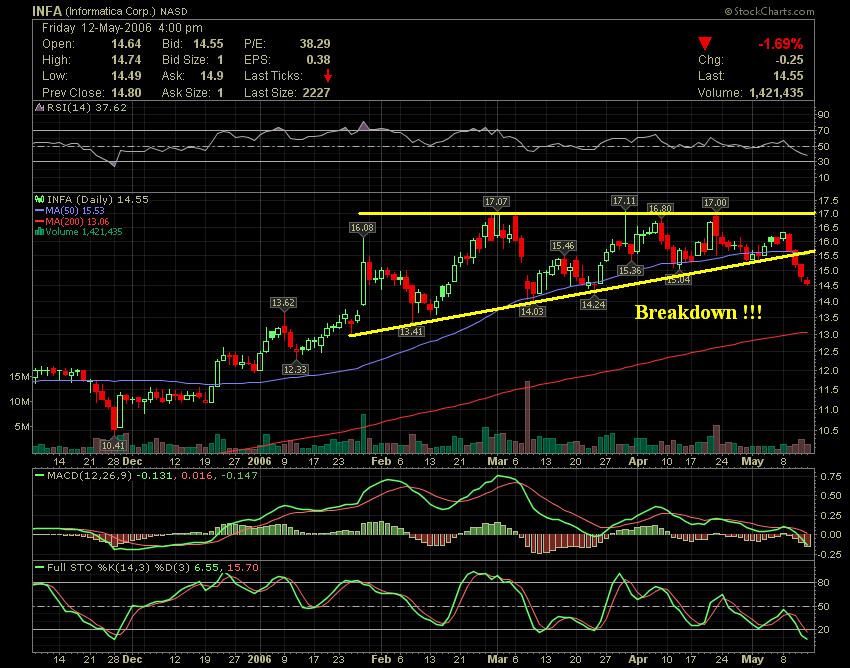
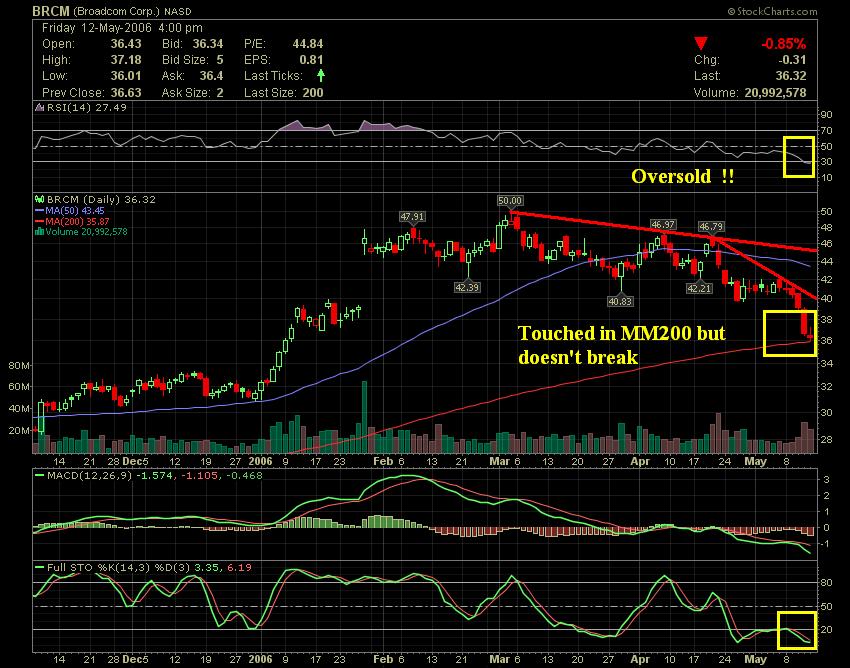 Chart courtesy of stockcharts
Ugly week for BRCM, but according to the chart above I think the Sell pressure it's done. According to chart above some indicators shows some exhaustion ( Oversold conditions ) in the descending direction, so now perhaps we can have some fresh air to go up.
Important note : the stock touched in the MM200 but doesn't break.
Important note : the stock touched in the MM200 but doesn't break.
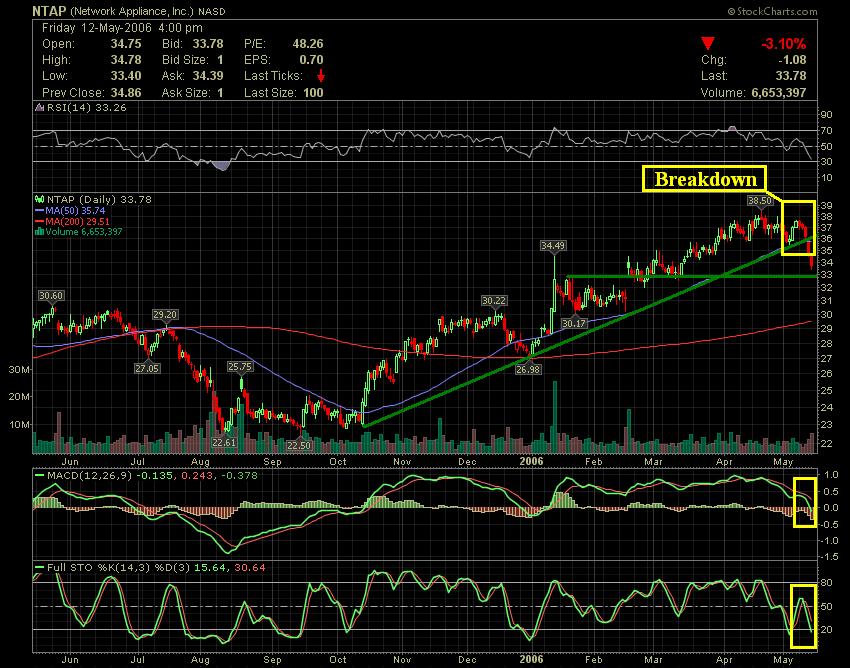 Chart courtesy of stockcharts
NTAP during this week breakdown the uptrend line with a signficant increase in the volume, all indicators are Bearishs however it's very near to reach the oversold conditions, from here the stock can react to the upside.
That's All. Have a great weekend !!!!
Good Business !!
AC
That's All. Have a great weekend !!!!
Good Business !!
AC


