Nasdaq , Dowjones , Crude Oil , CIENA , RIMM

Crude-oil futures fell on Friday on easing supply concerns after comments at a Paris oil conference led to speculation that some Nigerian production could re-start as early as next week.
May light sweet crude oil futures closed at $67.7 per barrel, down from Thursday's settlement at $67.94. According to chart above we can see that the crude Oil is now very near to break the red line ( medium term downtrend line ) and the indicators could sustain this break level, because all indicators are sustaining this Bullish side.
May light sweet crude oil futures closed at $67.7 per barrel, down from Thursday's settlement at $67.94. According to chart above we can see that the crude Oil is now very near to break the red line ( medium term downtrend line ) and the indicators could sustain this break level, because all indicators are sustaining this Bullish side.
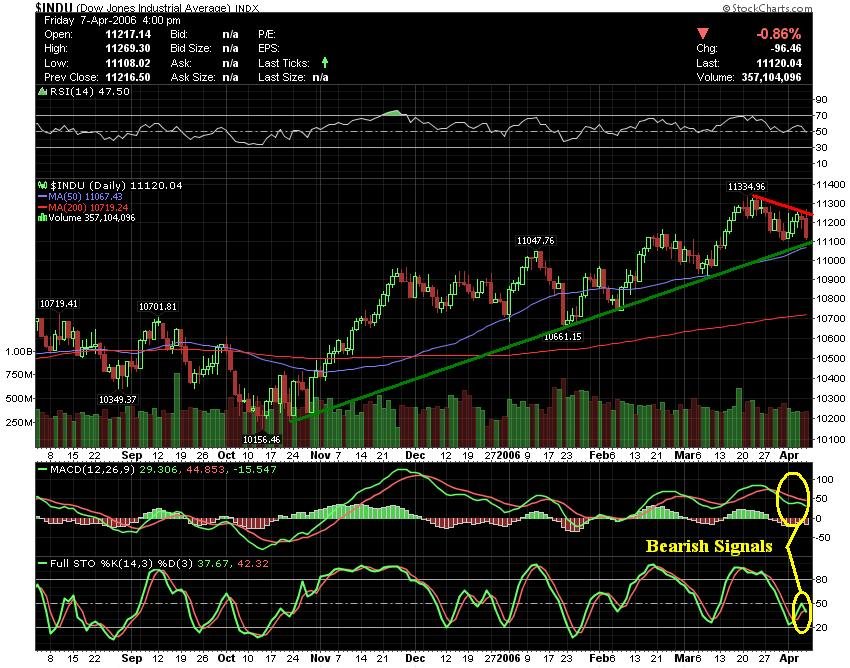
U.S. stocks ended lower on Friday after a strong March employment report renewed Wall Street's inflation worries, the Labor Department reported the U.S. economy created 211,000 jobs in March, more than the 187,000 expected by economists, and the unemployment rate down to 4.7 percent in March, its lowest point in 4 1/2 years.
The Dow Jones Industrial Average fell 96.46 points to 11,120.04. On the week, the benchmark index gained a modest 0.1%.
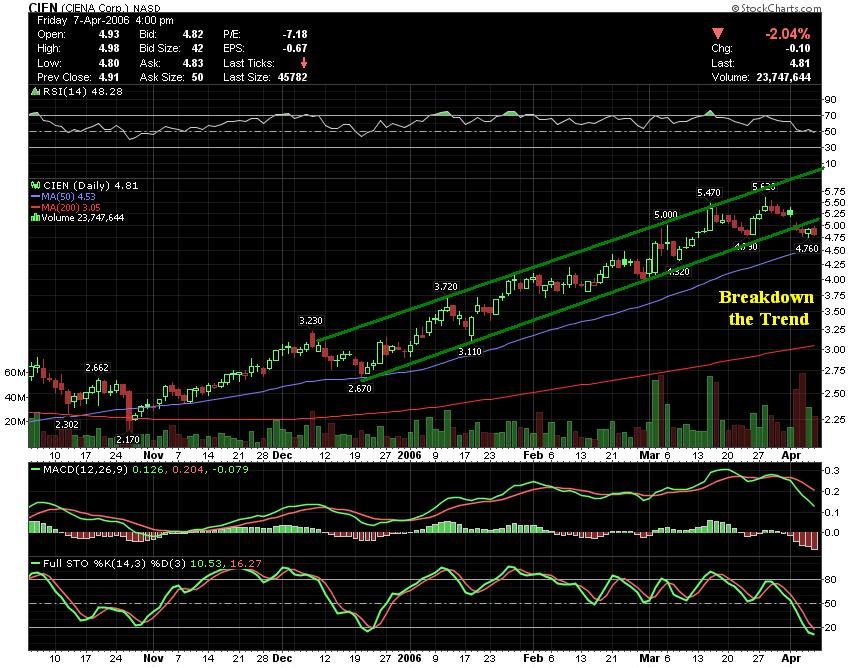
CIEN during this week breakdown the trend Up started on November of 2005 with huge volume on down days. Last daily Candle - Bearish Engulfing.
Supports : 4.59 Resistances : 4.92
Long Term - Bullish
Medium term - Bullish
Short term - Bearish
Supports : 4.59 Resistances : 4.92
Long Term - Bullish
Medium term - Bullish
Short term - Bearish

Research In Motion Ltd. shares fell 5.5% on Friday to $79.78 on volume that was three times the daily average for the shares, after the maker of BlackBerry wireless devices issued a disappointing outlook on plans to boost spending on marketing and product development.
According to chart above the indicators of this stock are showing now Bearish signals MACD + Fullsto + RSI. MM13 - 83.82 MM50 -78.50
Supports : 79.47 , 76.50 Resistances : 83.11
Hot stocks After-Hours :
FLWS ; SUMT ; HIV ; CRYP ; OLAB
That's All. Have a great weekend !!!
AC
According to chart above the indicators of this stock are showing now Bearish signals MACD + Fullsto + RSI. MM13 - 83.82 MM50 -78.50
Supports : 79.47 , 76.50 Resistances : 83.11
Hot stocks After-Hours :
FLWS ; SUMT ; HIV ; CRYP ; OLAB
That's All. Have a great weekend !!!
AC


