Good looking chart setups to watch this week

( click to enlarge )
Camber Energy Inc (NYSEAMERICAN:CEI) This daily chart represents a stock under tremendous accumulation. From a technical standpoint, the stock is overbought but I see the momentum and price gains continuing through next week. If the stock continues to see buying pressure I could see it trading well over $1 in the short term. Penny stock on watch.
( click to enlarge )
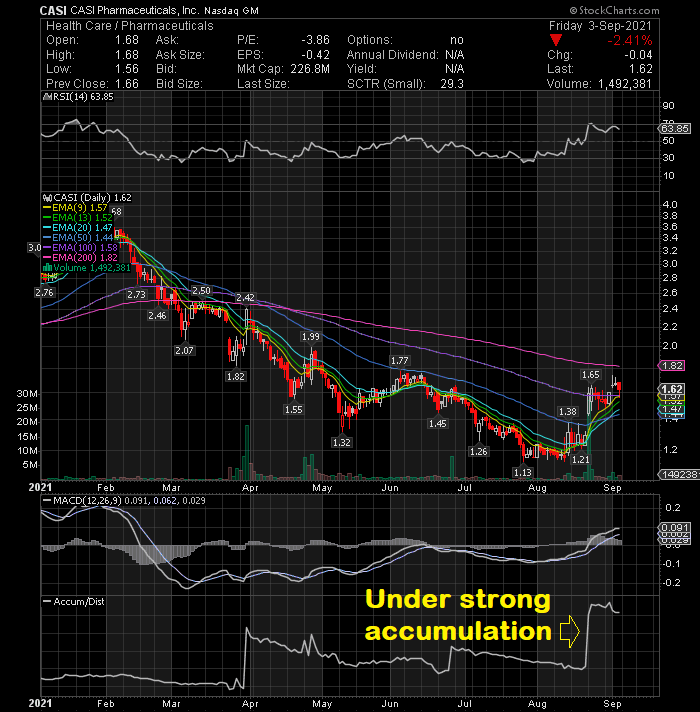
CASI Pharmaceuticals Inc (NASDAQ:CASI) The daily chart is shaping up and I expect the next point of resistance to be at $2.25. At some point CASI will take off and never look back. I think that day will come soon and those buying at these prices will be thanking me down the road. Oppenheimer analyst Leland Gershell recently raised the price target on CASI to $6.00 (from $5.00) while maintaining Outperform rating and the CEO purchased 480000 shares in August owning more than 5 million shares. I think CASI is heading higher from here and will make an excellent trade going forward.

( click to enlarge )
Exela Technologies Inc (NASDAQ:XELA) Volume has lightened up and the price is holding up nicely above the major short-term rising EMAs. This looks like the spot where the bulls will begin to make their move. From a technical standpoint, the stock may be ready to break out of this potential bullish flag consolidation while MACD is also starting to move higher. Only a close above 2.75 would suggest further upside. XELA will move quickly, so keep it on your screen.
( click to enlarge )
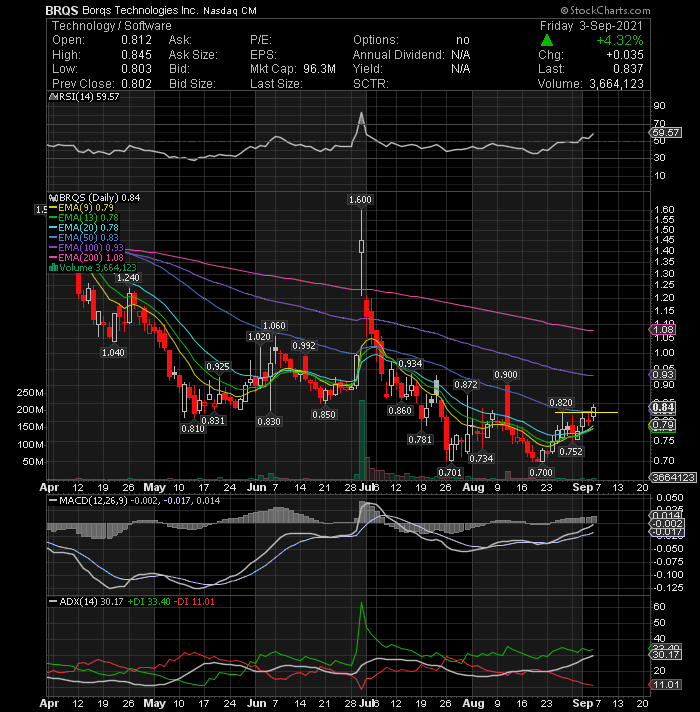
Borqs Technologies Inc (NASDAQ:BRQS) volume and price are on the rise and this stock is really getting some momentum behind it. The share price has finally crossed and closed above the declining 50-day EMA, which is very positive. All major short-term EMAs have started moving up, with the 9-day EMA above the 20-day EMA for the first time in more than 2 months. Friday’s intraday high of 0.845 was also the highest level the stock has touched in more than two weeks. The daily technical indicators are pointing to a continuation of the rally.

( click to enlarge )
Enveric Biosciences Inc (NASDAQ:ENVB) The buying was coming quickly on Friday for this stock. I am interested to see if it keeps going this week. It is on watch.

( click to enlarge )
Medavail Holdings Inc (NASDAQ:MDVL) I accumulated a lot of shares around $3 and the stock is paying off handsomely now. As I mentioned several times, the gap zone is my target. Let the profits run.

( click to enlarge )
Globalstar (NYSEAMERICAN:GSAT) The $2.42 area is a critical resistance region that can determine overall bias for the stock in the short-term. Bulls are now attacking the 2.25 price level, a break above could trigger a rally towards 2.42 resistance again. Keep an eye on these levels. Love the look of this hourly chart.

( click to enlarge )
Nio Inc (NYSE:NIO) is on the verge of a possible technical breakout. The stock closed slightly below the 50-day EMA on the daily chart. A breakout above this key EMA is a signal that there is a potential long-term trend change taking place. The strongest sign of a bullish momentum is the daily MACD indicator which has just started to increase. The RSI is also showing positive signs on the stock. On watch.

( click to enlarge )
Clover Health Investments Corp (NASDAQ:CLOV) The more it consolidates the bigger and strong run/squeeze it will have. On the technical side, MACD and ADX all point to an upward trend while RSI is also rising. Watch the stock closely on Tuesday, and once it breaks through $9, get ready to enter the trade.
Disclaimer : This is not an investment advisory, and should not be used to make investment decisions. Information in AC Investor Blog is often opinionated and should be considered for information purposes only. No stock exchange anywhere has approved or disapproved of the information contained herein. There is no express or implied solicitation to buy or sell securities. The charts provided here are not meant for investment purposes and only serve as technical examples. Don't consider buying or selling any stock without conducting your own due diligence.
Thanks for visiting AC Investor Blog.
AC
Labels: BRQS, CASI, CEI, CLOV, ENVB, GSAT, MDVL, NIO, XELA


