-Financial Tools Futures Market--TRADE IDEAS-- OPTION ALERTS -BENZINGA PRO-

Saturday, February 06, 2021 

Great looking setups to watch next week

Dearest readers,

I wanna start by thanking all of you for following me on Twitter. Last week I achieved one of my main goals for this year by reaching the fantastic milestone of 100000 on Twitter. I can't thank you enough for your continued support, you guys are the best. 

Trading stocks is not easy for beginners or professionals, it is really very hard and requires a lot of attention and knowledge. If stock trading was easy, everyone would be doing it. You can be successful at the stock market, with patience, discipline and a good trade set-up. The key objective is to make money and not lose it. Do not be hasty to buy or sell a stock, every day there are new opportunities to make money. Being patient is the key to the success of any trader.

( click to enlarge )

Virios Therapeutics LLC (NASDAQ:VIRI) has been falling since the first trading day from over $16.5 to $6.45 and finally it seems to be bottoming. Last week broke the primary downtrend line on decent volume is now touching the $8 area resistance that it should be broken very soon. I have been accumulating this stock for a run to $10.80 at least. If you haven't added VIRI to your watchlist, now is the time.

( click to enlarge )

Vislink Technologies Inc (NASDAQ:VISL) broke on Friday above its recent high and rose to $3.86 hitting the highest price in seven months. Further rally could be seen to retest $4.5 long-term resistance. As long as the stock stays above the EMA200 located now 2.42, the bullish scenario is still intact. Technical chart shows bullish sign with %K line on top of %D line and MACD on top of signal line. Next targets for the stock are $4.5 and $4.62. Only a close below $2.86 (9-day EMA) reverses the current short-term uptrend. Now that the stock is above the major resistance more buyers should be coming. Long setup on watch.

( click to enlarge )

Strong reversal Friday on heavy volume, forming a nice big bullish hammer candle. Such a bullish candle is a signal that the momentum is reversing, so the downside price action is limited. The next level to watch is now: $13.5, breaking that level should initiate a new buying wave up to 14.50

( click to enlarge )

Sellas Life Sciences Group Inc (NASDAQ:SLS) After a solid breakout on rising volume SLS has pulled back to support near $9 and should set up for its next upside move. Things are now beginning to turn in favor of the Bulls. The MACD confirms the recent jump and daily RSI also shows that there's more upside to come. SLS should be watched closely, it could pay off big if it shoots up from its current level. Keep a close eye on SLS because once it does move, it should be a good one.

( click to enlarge )

MARPS was up on Friday and I am keeping it on the list for next week. With the continued rise in oil prices, this small energy and low float play could see another big push to $9 On my fireworks list.

( click to enlarge )

Professional Diversity Network, Inc. (NASDAQ:IPDN) failed to continue its bearish correction on Friday showing inclusive relative strength. On the daily chart above we can see that the price is now testing the major key resistance level indicating a critical phase. A break above the resistance could trigger further bullish pressure testing 3.3/3.40 region and could potentially end this large sideways trading range. Im long before it explodes higher.

( click to enlarge )

BlackBerry (NYSE:BB) has been recovering from its recent sell off and might accelerate the short-term momentum further towards its next major hurdle near the 14 mark with some intermediate resistance near the 13.67 Key hourly momentum indicators continue to show positive trends.

( click to enlarge )

Akerna Corp (NASDAQ:KERN) The stock had a nice breakout and I am looking for it to continue next week. Any pullback to pivot is buyable.

( click to enlarge )

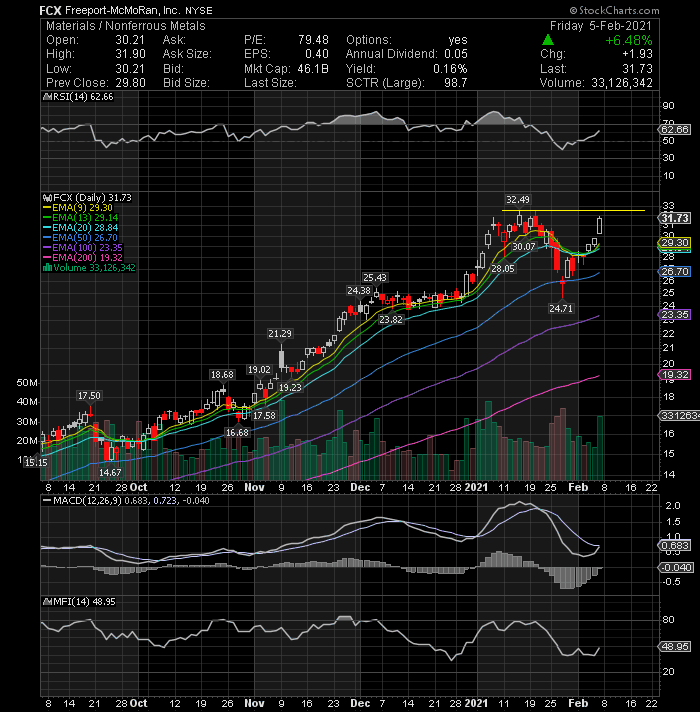
Freeport-McMoRan (NYSE:FCX) Resistance remains at $32.5 and I would be a buyer on a break above that level for a trade.

( click to enlarge )

Castor Maritime Inc (NASDAQ:CTRM) made a strong upside reversal Friday on heavy volume. Expect an initial run up to 90c with a break higher moving to the $1.2 zone. SL 60c

( click to enlarge )

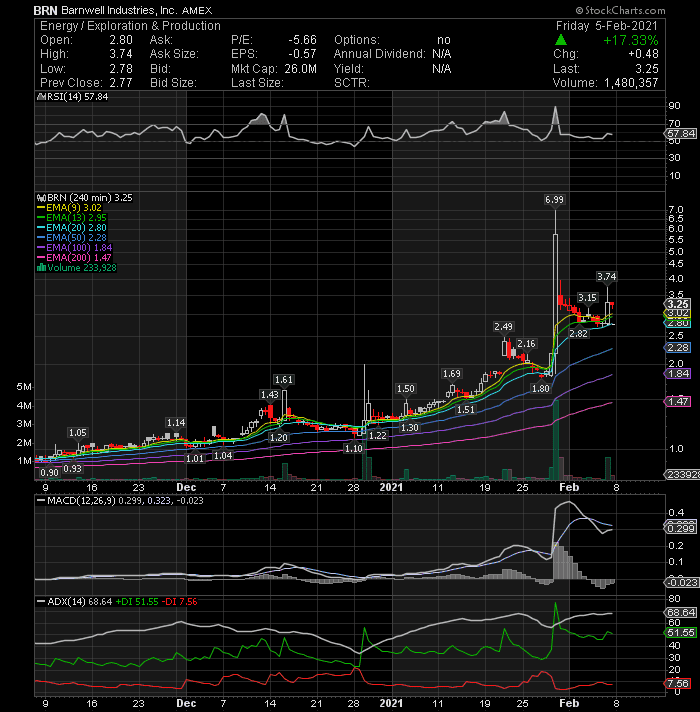
I've alerted my Stocktwits/Twitter followers about the potential upside movement in BRN shares on Friday morning one hour after the opening bell around the 2.85 level. The stock has come up to my expectations as it was among the top gainers of Nasdaq and closed up 17.33 percent at $3.25. These gains are really significant and represent substantial profit for investors who took advantage of my alert early, before the market caught on. The stock needs to take out the  resistance at 3.74 to continue higher. Keeping it on the list.

( click to enlarge )

Coty, Inc. (NYSE:COTY) waiting for a break above the 7.86 level for a long position. The stock is up against a lateral resistance level and expected to break out. COTY just turned bullish on charts. Daily MACD is positive and above the signal line. RSI is also moving up and above its 50% level. I think the stock has room to go higher.

During the day I tweet many times to my readers. I encourage everybody to subscribe AC Investor Blog twitter and newsletter, so you can receive my trade ideas and stock news in real time.

Disclaimer : This is not an investment advisory, and should not be used to make investment decisions. Information in AC Investor Blog is often opinionated and should be considered for information purposes only. No stock exchange anywhere has approved or disapproved of the information contained herein. There is no express or implied solicitation to buy or sell securities. The charts provided here are not meant for investment purposes and only serve as technical examples. Don't consider buying or selling any stock without conducting your own due diligence.

Thanks for visiting AC Investor Blog.

AC

Labels: , , , , , , , , , , ,

Bookmark and Share

Saturday, July 15, 2017 

My Watchlist for Monday, July 17

( click to enlarge )

Vodafone Group Plc (NASDAQ:VOD) The recent consolidation is nearing an end and this stock could be ready to embark on its next leg higher. I'd look to the $20.25 level moving as the next buy point. If it passes that, then we have room to run to $30

( click to enlarge )

Freeport-McMoRan Inc (NYSE:FCX) Watch Monday's action for a possible breakout over $12.69. The daily technical chart above is showing a slightly bullish momentum again. Let’s see whether it can gather enough momentum to break and close above this key resistance price level next week. If the Bulls are able to push through this level, there will be another rally towards 13

( click to enlarge )

E I Du Pont De Nemours And Co (NYSE:DD) Small bullish flag formation. If the stock can close above $85 next week, then expect more upside.

( click to enlarge )

American International Group Inc (NYSE:AIG) is a stock to watch closely next week. It has a big resistance range at 64.24/64.53, which is where we need it to break to make a big move. Technicals are showing bullish signals supported by rising MACD and RSI on the daily charts. On watch.

( click to enlarge )

Anthera Pharmaceuticals Inc (NASDAQ:ANTH) had a nice move on the upside in Friday's afternoon and looks like it wants to go higher. Next week we could see extension of this new momentum towards $1.78 area.

If you want to contact me for advertising opportunities on blog or twitter, then get in touch via email

Disclaimer : This is not an investment advisory, and should not be used to make investment decisions. Information in AC Investor Blog is often opinionated and should be considered for information purposes only. No stock exchange anywhere has approved or disapproved of the information contained herein. There is no express or implied solicitation to buy or sell securities. The charts provided here are not meant for investment purposes and only serve as technical examples. Don't consider buying or selling any stock without conducting your own due diligence.

Thanks for visiting AC Investor Blog.

AC

Labels: , , , ,

Bookmark and Share

Wednesday, January 04, 2017 

My Watchlist for Thursday, January 05

( click to enlarge )

Vuzix Corporation (NASDAQ:VUZI) has a very interesting chart as the stock looks to be ready for another good upside move. VUZI traded good volume today over 422k shares and finished up on the day 3.47%, above its EMA50. Indicators are also showing signs of recovery. A move towards $7.75 can be expected as long as $7.09 holds. This stock is a short squeeze candidate.

( click to enlarge )

Freeport-McMoRan Inc (NYSE:FCX) broke out of a bottom/accumulation pattern. Now, we just need to see on Thursday a confirmation of the reversal. Indicators are turning up.

( click to enlarge )

GoPro Inc (NASDAQ:GPRO) is in the process of bottoming and I expect a pop above $9.15 at some point in the coming days. Key technical indicators are showing positive divergences.

( click to enlarge )

Dynavax Technologies Corporation (NASDAQ:DVAX) Watching for $4.45 (EMA50) breakout. All indicators are in favor of an upward price movement.

( click to enlarge )

Trillium Therapeutics Inc. (NASDAQ:TRIL) Watch Thursday's action for a possible breakout over $6. A break above this key resistance level will confirm the short-term reversal and the following uptrend will take price up to 7.2 zone initially.

If you want to contact me for advertising opportunities on blog or twitter, then get in touch via email

Disclaimer : This is not an investment advisory, and should not be used to make investment decisions. Information in AC Investor Blog is often opinionated and should be considered for information purposes only. No stock exchange anywhere has approved or disapproved of the information contained herein. There is no express or implied solicitation to buy or sell securities. The charts provided here are not meant for investment purposes and only serve as technical examples. Don't consider buying or selling any stock without conducting your own due diligence.

Thanks for visiting AC Investor Blog.

AC

Labels: , , , ,

Bookmark and Share

Tuesday, February 16, 2016 

Stocks to Watch for February 17, 2016

( click to enlarge )

Nantkwest Inc (NASDAQ:NK) seems to be a promising stock to follow in the coming sessions. ZNGA had a large spread and large volume today successfully breaking the downtrend that has been in place since mid-January. Also worth noting is the price which is now above the declining 9EMA. This denotes strength for the stock. If you paid attention to Friday's alert on twitter and got into Nantkwest at the opening bell, congratulations !!! The level of the daily technical indicators does suggest the short-term bounce should continue for a bit longer. If it can get back over 8.14 look for a move to resistance at 9.16 and then to 10.

( click to enlarge )

Ciena Corporation (NYSE:CIEN) the $19.50 area is a critical resistance region that can determine overall bias for the stock in short-term. Bulls are now attacking the 50-day EMA, a break above could trigger a rally towards 20 resistance. Keep an eye on these levels.

( click to enlarge )

Nice tweeted under 5.50 last week. ZIOPHARM Oncology Inc. (NASDAQ:ZIOP) closed strong today above the 20-day EMA for the first time since December. This momentum could push this stock much higher from here. Next resistance is now seen at 6.29 then 6.80.

( click to enlarge )

Freeport-McMoRan Inc (NYSE:FCX) was able to get up through the key resistance level and sustained the move. This could be the start of a new trend higher. Watch the stock closely tomorrow.

( click to enlarge )

AK Steel Holding Corporation (NYSE:AKS) is on the verge of a possible technical breakout. The stock closed slightly below the 100-day EMA on the daily chart. A breakout above this key EMA is a signal that there is a potential long-term trend change taking place.

If you want to contact me for advertising opportunities on blog or twitter, then get in touch via email

Disclaimer : This is not an investment advisory, and should not be used to make investment decisions. Information in AC Investor Blog is often opinionated and should be considered for information purposes only. No stock exchange anywhere has approved or disapproved of the information contained herein. There is no express or implied solicitation to buy or sell securities. The charts provided here are not meant for investment purposes and only serve as technical examples. Don't consider buying or selling any stock without conducting your own due diligence.

Thanks for visiting AC Investor Blog.

AC

Labels: , , , ,

Bookmark and Share

Wednesday, March 05, 2014 

Stocks to Watch for March 06, 2014

( click to enlarge )

Bank of America Corp (NYSE:BAC) could be in the early stages of a technical breakout. If the stock price can break through 17.41, expect to see heavy volume drive the stock higher. Looking at the technical chart, the MACD has crossed above its signal and reversed its falling trend. The RSI has moved above the 50% level and the stock has closed above all five EMAs. The bull market is intact.

( click to enlarge )

Gulf Resources, Inc. (NASDAQ:GURE) With the spike in volume and momentum surging in today's trading sesisons, there is a high possibility that the stock can appreciate even more in value during the coming sessions. So, put this stock on your radar and watch it trade.

( click to enlarge )

Alcoa Inc (NYSE:AA) Watch this one as it approaches this key resistance area. All technical indicators are bullish. Next buy area when clears the 12.29 level on heavy volume.

( click to enlarge )

Great Panther Silver Ltd (NYSEMKT:GPL) Over 1.38 for a breakout trade.

( click to enlarge )

Cleveland BioLabs, Inc. (NASDAQ:CBLI) potential gap fill play for Thursday. MACD is still rising and getting close to centerline, (positive divergence).

( click to enlarge )

Freeport-McMoRan Copper & Gold Inc. (NYSE:FCX) is testing its resistance at 34. This is a critical resistance region that can determine overall bias for the stock in short-term. MACD is rising and heading to centerline. Keep it on watch.

During the day I tweet many times to my readers. I encourage everybody to subscribe AC Investor Blog twitter and newsletter, so you can receive my trade ideas and stock news in real time.

Disclaimer : This is not an investment advisory, and should not be used to make investment decisions. Information in AC Investor Blog is often opinionated and should be considered for information purposes only. No stock exchange anywhere has approved or disapproved of the information contained herein. There is no express or implied solicitation to buy or sell securities. The charts provided here are not meant for investment purposes and only serve as technical examples. Don't consider buying or selling any stock without conducting your own due diligence.

Thanks for visiting AC Investor Blog.

AC

Labels: , , , , ,

Bookmark and Share

Thursday, February 12, 2009 

Trade Ideas for Friday - AAPL and FCX

Chart courtesy of www.stockcharts.com ( click to enlarge )

FCX shares closed at 29.40 on Thursday. The price is now within the Bollinger band and is sitting near the 20 day moving average. It looks like moving into consolidation phase after the recent decline. The MACD indicator is above its signal line and is indicating further strength. In addition, the ADX is increasing and is near 20 level which shows a strong trend is developing. The RSI indicator is moving up above 50 and the +DI is greater than the -DI by a great margin, indicating a Bullish trend. The stock is currenty facing resistance around 31.45. Fresh long should be made only when the stock moves above this resistance level.

Chart courtesy of www.stockcharts.com ( click to enlarge )

AAPL - Looking at the technical daily chart of aaple there appears to be marginal downside risk from prevailing levels. The short-term trend is bullish and a move to the Rs 100-103 range appears likely. The stock seems to have completed the recent pull back. The 20 day moving average is showing a positive gradient and is rising since the beginning of February. This is a bullish sign. The Bollinger is also showing a slightly upward channel and the stock looks to be moving towards the upper part of the Bollinger bands. A move above 103.60 would confirm that the stock has commenced the next phase of an upward move.

Disclaimer : Trading stocks involves risk, this information should not be viewed as trading recommendations.The charts provided here are not meant for investment purposes and only serve as technical examples.

That's all Folks. See you tomorrow !!!

AC

Labels: ,

Bookmark and Share

Monday, January 15, 2007 

Highlights for tomorow : Earnings reports

Chart courtesy of stockcharts

It will report earnings on January 16 , mean estimate 0.22

Chart courtesy of stockcharts

It will report earnings on January 16 , mean estimate 2.12

Chart courtesy of stockcharts

It will report earnings on January 16 , mean estimate 0.25

Disclaimer : Trading stocks involves risk, this information should not be viewed as trading recommendations.The charts provided here are not meant for investment purposes and only serve as technical examples.

That's All. Enjoy your evening !!!

AC

Labels: , ,

Bookmark and Share
Contact

About Me

    Photobucket
  • I'm a 48 year old Independent Trader using proprietary technical analysis with more than 20 years experience of investing in the US stock markets. I started this blog in 2006 simply as a way to share my thoughts about capital, risk management, and trading. My blog contains only my personal opinion and is provided for informational purposes only.

  • Benzinga.com supporter

    Benzinga.com supporter


    FREE NEWSLETTER

      Enter your email address:

      Delivered by FeedBurner

      Subscribe my feed :

    Support AC

    • Support AC Investor Blog, Donate with PayPal

    Advertising

      Interested in advertising on AC Investor Blog ? Click Here

    TRANSLATOR

    Site Information

    Stock Market Blogroll

    Friends BLOGROLL

    ARCHIVES

Powered by Blogger
and Blogger Templates


Add to Google