-Financial Tools Futures Market--TRADE IDEAS-- OPTION ALERTS -BENZINGA PRO-

Saturday, April 21, 2018 

Ten trade ideas for next week
( click to enlarge )

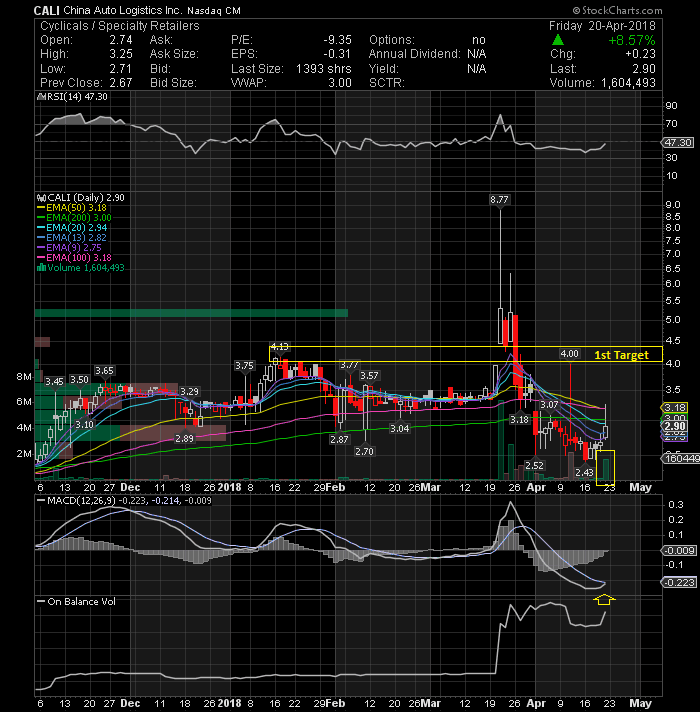
China Auto Logistics Inc (NASDAQ: CALI) had a very good rally on Friday accompanied with large volume. This is one seems to be turning around again and is slowly starting a positive upward trend. Some key technical daily indicators are confirming the recent positive movement. The positive MACD divergence on the daily chart usually means that an upward movement is coming. Looks like it is gonna squeeze some shorts to me. There is a short-term upward potential of up to $4-4.3 based on the resistance line connecting the previous peaks. Definitely on watch.
( click to enlarge )

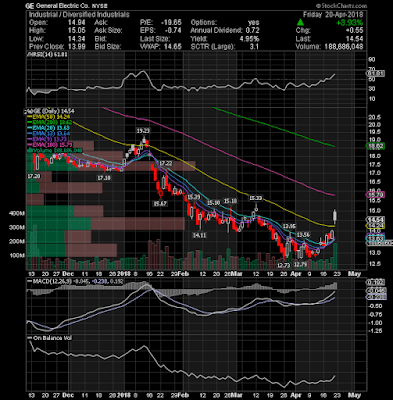
General Electric Company (NYSE: GE) is catching the attention of market players again after the earnings report. The stock was very active as it closed up $.55 on 2x normal daily volume. It might face a period of sideways action while it consolidates the gains booked in the last sessions. Resistance is now located at $15.1 but if the stock can push up into the $15.4's, I feel it could retest $15.67 or above. Chart looks bullish.

( click to enlarge )

Advanced Micro Devices, Inc. (NASDAQ: AMD) broke down its rising wedge last week on increased volume and selling pressure, making a move to next support in the $9.5 area likely.

( click to enlarge )

I have Net Element Inc (NASDAQ: NETE) on my watchlist once again. It may be ready to break out of this long down trendline. Bullish MACD cross on daily. Friday’s high was $9.01, which is resistance for the continuation move on Monday. There is a lot of upside in this trade, so keep the stock on your screen next week.

( click to enlarge )

SAExploration Holdings Inc (NASDAQ: SAEX) thin name with a good looking chart. The stock broke resistance but closed below, volume starting to expand. Keep an eye on it to break Friday’s highs.

( click to enlarge )

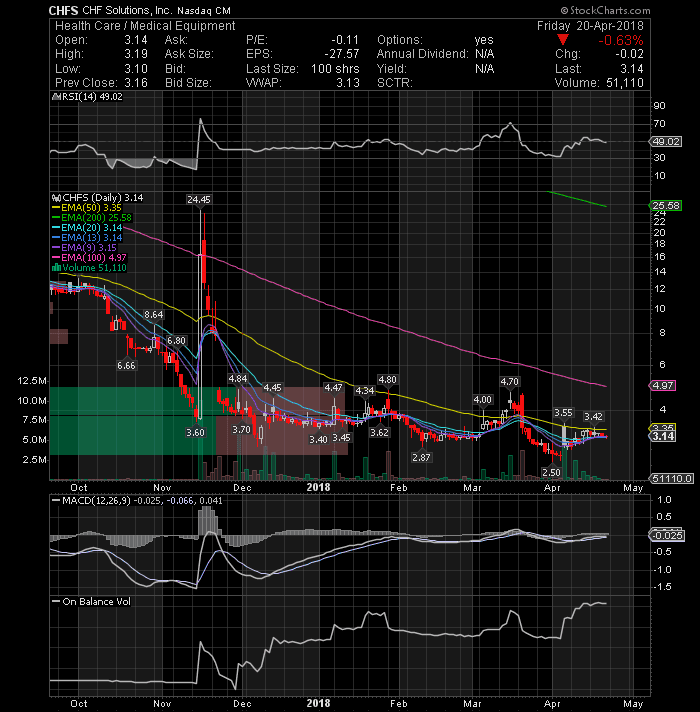
CHF Solutions Inc (NASDAQ: CHFS) traded down over the last trading sessions but not enough to make me stop watching. The volume was relatively weak compared with recent sessions when prices rose, which means traders are not betting on the downside. If the stock can break through the 50-day EMA we should see heavy buying come and it will be a great buy here.

( click to enlarge )

Sky Solar Holdings Ltd (NASDAQ: SKYS) Price should become explosive if this chart pattern is broken to the upside with volume. I want to go long this stock on a move above $1.35 for a day trade.

( click to enlarge )

Eleven Biotherapeutics Inc (NASDAQ: EBIO) broke out from its sideways consolidation on Friday with a 17% rally and a close over resistance at $1.84. Keep this one on your radar over the next week.

( click to enlarge )

Associated Banc Corp (NYSE: ASB) Momentum has turned bullish, and a break above resistance at 27.2 would open the door for a rally to 30.

( click to enlarge )

Cleveland-Cliffs Inc (NYSE: CLF) is an eye catcher for its large volume and long spread on the last trading sessions. Potential swing long above 8.17

During the day I tweet many times to my readers. I encourage everybody to subscribe AC Investor Blog twitter and newsletter, so you can receive my trade ideas and stock news in real time.

Disclaimer : This is not an investment advisory, and should not be used to make investment decisions. Information in AC Investor Blog is often opinionated and should be considered for information purposes only. No stock exchange anywhere has approved or disapproved of the information contained herein. There is no express or implied solicitation to buy or sell securities. The charts provided here are not meant for investment purposes and only serve as technical examples. Don't consider buying or selling any stock without conducting your own due diligence.

Thanks for visiting AC Investor Blog.

AC

Labels: , , , , , , , , ,

Bookmark and Share

Monday, May 29, 2017 

8 stocks to watch this week

( click to enlarge )

Tesla Inc (NASDAQ:TSLA) remains one of the hottest stocks on the market and could be ready to breakout of this sideways pattern. Price should become explosive if this daily chart pattern is broken to the upside with volume. Shorts continue to be on the wrong side of the trend.

( click to enlarge )

Is FORM Holdings Corp. (NASDAQ:FH) on your Radar ? It better be. Insiders have been buying shares at an accelerated place. They bought more than 155000 shares in the last two weeks. The frequency and quantity of the insider activity is a very important indicator of insider sentiment. From a technical standpoint, the stock is reversing off recent lows and is seeing strong buying volume. It broke out of the descending channel and I think it could be in the early stages of a rally that will bring the stock back over $2.25 a share and ultimately $2.60+. FH has an explosive chart in progress. Im long.

( click to enlarge )

China Auto Logistics Inc (NASDAQ:CALI) has been pulling back after a strong rally early in April. As you can see from the technical daily chart above, in this corrective phase the stock has found strong support around the 2.25-2.30 level on multiple occasions. At this point, traders could expect a strong bounce and a potential breakout of the downtrend line. MACD is curling up and the accumulation remains high.

( click to enlarge )

Cleveland BioLabs, Inc. (NASDAQ:CBLI) seems to be a promising stock to follow. As I mentioned on Twitter last week, the stock has been developing an interesting pattern accompanied by an increase in the volume. Daily momentum continues to show strength on the daily chart, with RSI above 50 line and MACD in positive territory and above its signal line. Based on this, I believe we could see further gains that could push the stock towards $5. CBLI is a fast moving stock, so you need to watch it closely next week.

( click to enlarge )

Marvell Technology Group Ltd. (NASDAQ:MRVL) surged 4.31% Friday on one of the heaviest volume sessions this year, with 20 million shares traded. The stock closed slightly below the high of the day, which now represents the next resistance for the follow through move on Tuesday. If a breakout above this level occurs, we could see a continuation of current momentum. After strong gains, the risk of profit taking is high, so play with tight stops.

( click to enlarge )

Rentech, Inc. (NASDAQ:RTK) showed strength all day on Friday and price broke the descending triangle chart pattern to the upside on volume. The stock is in the process of bottoming and I expect a pop above $.60 at some point in the coming days. Momentum indicators are looking bullish with RSI inching away above the middle level and MACD rising. This momentum could push this stock much higher from here, so keep the stock on your radar for Tuesday’s trading day as there is good upside potential in this move. Short-term levels to watch 56c and 68c.

( click to enlarge )

Infinera Corp. (NASDAQ:INFN) printed a strong bullish candle on Friday, showing huge buying pressure and the stock looks to be on the cusp of a breakout to the upside. Some technical indicators are turning up here. Further strength above $10.52 opens the door to +$11. Put her on your radar.

( click to enlarge )

Ocular Therapeutix Inc (NASDAQ:OCUL) On Friday jumped 73 cents, or 7%, on volume and broke definitely out of the pennant formation which the stock has consolidated over last sessions. Watch for continuation.

I would like to take this opportunity to thank all of you for your support, retweets and mentions. Im about to hit 50000 followers on Stock Twists and 25000 on Twitter and that makes me very happy. Unfortunately I cant answer everyone in real-time. The best way to get in contact with me is through my email address here at the blog. Thank you very much.

Disclaimer : This is not an investment advisory, and should not be used to make investment decisions. Information in AC Investor Blog is often opinionated and should be considered for information purposes only. No stock exchange anywhere has approved or disapproved of the information contained herein. There is no express or implied solicitation to buy or sell securities. The charts provided here are not meant for investment purposes and only serve as technical examples. Don't consider buying or selling any stock without conducting your own due diligence.

Thanks for visiting AC Investor Blog.

AC

Labels: , , , , , , ,

Bookmark and Share

Thursday, May 25, 2017 

My Watchlist for Friday, May 26

( click to enlarge )

I'm watching Superconductor Technologies, Inc. (NASDAQ:SCON) for a possible breakout from current consolidation. This one looks like it wants higher to me.

( click to enlarge )

Skypeople Fruit Juice Inc (NASDAQ:SPU) On my swing long list. The stock has held support at the 2.50 level and is displaying a screaming buy divergence on the upside. Nearest resistance for the stock is at $3. If this level is crossed and the stock is able to sustain above this level, then it might go to $3.62. Low float stock with a high short interest. A Good catalyst for Bulls :)

( click to enlarge )

China Auto Logistics Inc (NASDAQ:CALI) Another China stock whose pattern is looking quite good here for higher prices. Looks to be setting up for an upside move, as the stock has held up well the past few sessions. Breakout watch above 2.5

( click to enlarge )

MannKind Corporation (NASDAQ:MNKD) Breaking out to the upside from its recent consolidation. Thursday’s high of $1.48 is resistance for the next upside move. If the stock can break through this level, we should see another strong move. MNKD can be a good trading stock, so keep it on your radar for the next few sessions.

( click to enlarge )

Abercrombie & Fitch Co. (NYSE:ANF) is on my watch list. The declining EMA200 at 14.14 is pretty much the pivot here. If it breaks and closes above, we could see 15 quickly.

If you want to contact me for advertising opportunities on blog or twitter, then get in touch via email

Disclaimer : This is not an investment advisory, and should not be used to make investment decisions. Information in AC Investor Blog is often opinionated and should be considered for information purposes only. No stock exchange anywhere has approved or disapproved of the information contained herein. There is no express or implied solicitation to buy or sell securities. The charts provided here are not meant for investment purposes and only serve as technical examples. Don't consider buying or selling any stock without conducting your own due diligence.

Thanks for visiting AC Investor Blog.

AC

Labels: , , , ,

Bookmark and Share
Contact

About Me

    Photobucket
  • I'm a 48 year old Independent Trader using proprietary technical analysis with more than 20 years experience of investing in the US stock markets. I started this blog in 2006 simply as a way to share my thoughts about capital, risk management, and trading. My blog contains only my personal opinion and is provided for informational purposes only.

  • Benzinga.com supporter

    Benzinga.com supporter


    FREE NEWSLETTER

      Enter your email address:

      Delivered by FeedBurner

      Subscribe my feed :

    Support AC

    • Support AC Investor Blog, Donate with PayPal

    Advertising

      Interested in advertising on AC Investor Blog ? Click Here

    TRANSLATOR

    Site Information

    Stock Market Blogroll

    Friends BLOGROLL

    ARCHIVES

Powered by Blogger
and Blogger Templates


Add to Google


