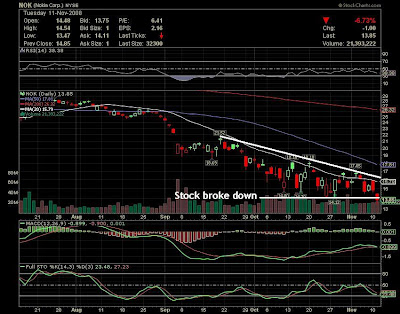
 Chart courtesy of www.stockcharts.com ( click to enlarge )
NOK - The stock broke down from this descendong triangle by falling 6 per cent, accompanied by above-average volume. With this recent fall, the moving-average convergence and divergence (MACD) is featuring in the negative territory that is below the zero line. I'm bearish on the stock in the short-term. Based on the technical sell signal noted, it is advisable to avoid NOKIA for now.
 Chart courtesy of www.stockcharts.com ( click to enlarge )
WFC - The stock faces a strong resistance at $29.15 ( 200-day moving average ), and unless this level is crossed on a close basis, the medium term outlook remains negative. For now, the stock has managed to keep itself above an important support level at $27. A move above the $29.15 mark would be a good indication for the stock, and thereafter the outlook will improve. Let's keep an eye on it.
 Chart courtesy of www.stockcharts.com ( click to enlarge )
CIEN -The stock is coming very near to its horizontal support of $6.60, trading near the lows of the year. Any close below this level will signal the next leg down has begun. Stop yourself out on any close below $6.60. Technically, the RSI had just broken the uptrend trendline and fallen below 50. In addition, MACD histogram had just turn negative while MACD crossed below the faster “trigger” line or the red line.
Disclaimer : Trading stocks involves risk, this information should not be viewed as trading recommendations.The charts provided here are not meant for investment purposes and only serve as technical examples.
That's All. See you tomorrow !!
AC
Labels: CIEN, NOK, WFC
 Chart courtesy of www.stockcharts.com ( click to enlarge )
 Chart courtesy of www.stockcharts.com ( click to enlarge )


