-Financial Tools Futures Market--TRADE IDEAS-- OPTION ALERTS -BENZINGA PRO-

Tuesday, October 31, 2006 

Keep MRVL stock in your radar....

Chart courtesy of stockcharts

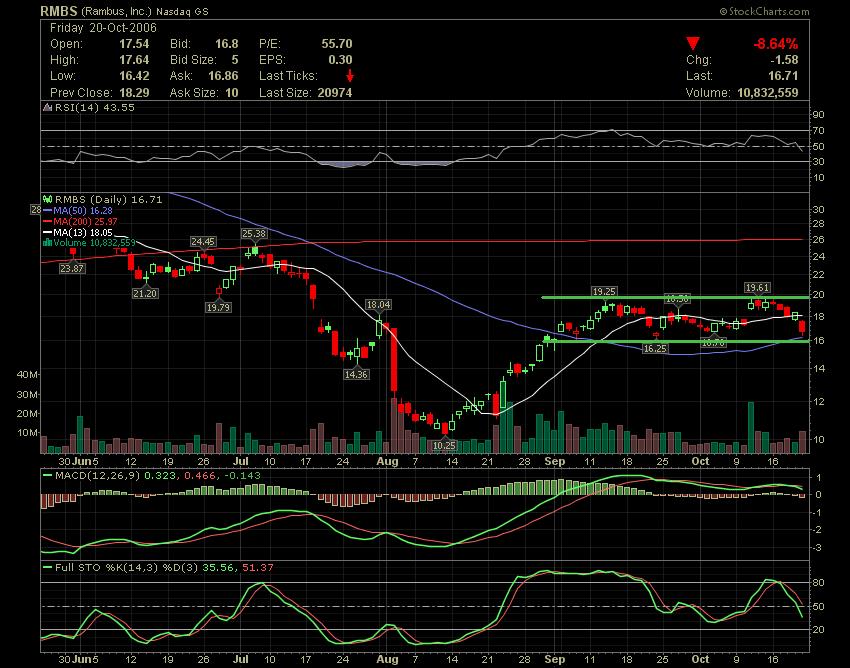
Shares of MRVL surged 4% today to 18.28$ per share. The volume was strong again as show the thechnical chart, this stock is moving fast followed by volume, this movement could be again related with a buyout rumor, this news have circulated on friday , Buyout Rumor by Thestreet.com.
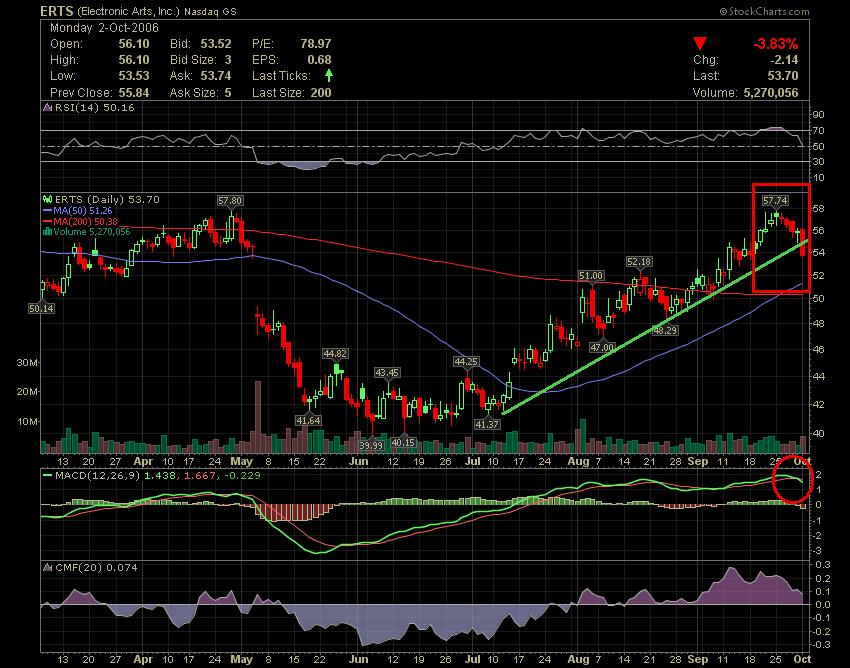
Stock closed above 50 dma and MACD is above 0 -Bullish Signals, however the stock could see some selling pressure near 19$, as show red line in chart.

That's All. Have a nice evening !!

AC

Bookmark and Share

Monday, October 30, 2006 

AAPL still strong & APOL have confirmed

Chart courtesy of stockcharts

Shares of AAPL still strong and trading in an uptrend since mild of July. Let's see if the stock will be able to keep this performance without break this trend.

Chart courtesy of stockcharts

Shares of APOL surged 2% today to 36.54$ and have confirmed my previous posts, time to think that the rebound started. The stock breakout the short downtrend as show the chart.

Disclaimer : Trading stocks involves risk, this information should not be viewed as trading recommendations.

That's All. Have a great evening !!!

AC

Labels: ,

Bookmark and Share

Friday, October 27, 2006 

US Markets Pull Back

Chart courtesy of www.stockcharts.com ( click to enlarge )

Following last post about APOL shares, the stock on Friday had a good performance because did not do a new low neither a double bottom only a high-low even in a bad day for the markets, so I still confident that the trend now will be on the upside.


Chart courtesy of www.stockcharts.com ( click to enlarge )

The daily chart of Nasdaq it show that recently 50 dma has croosed on top over 200 day moving average - a Bullish signal.

Chart courtesy of www.stockcharts.com ( click to enlarge )

Stocks pulled back Friday after the Commerce Department reported that the economy grew at the slowest pace in more than three years. Dow Jones industrial down 73.40, or 0.60 percent, at 12,090.26, Standard & Poor's 500 index down 11.74, or 0.85 percent, at 1,377.34, and the Nasdaq composite index fell 28.48, or 1.20 percent, to 2,350.62. A Pullback for a consolidation.

Disclaimer : Trading stocks involves risk, this information should not be viewed as trading recommendations.

That's all. Have a nice weekend !!!

AC

Labels: , , ,

Bookmark and Share

Thursday, October 26, 2006 

October was always a good time to Buy APOL

Chart courtesy of stockcharts

Shares of APOLLO group start to recover some strength that lost after the earning report. The technical chart (3 year) show that October was always a good time to buy the stock , and after the recent loses this could be a perfect time to accumulate the stock at these levels. Indicator Full stochastic suggest a bounce soon with the fast line crossover slow line, expect trend to turn sideways or higher from here. The stock is also in a very oversold (RSI, Stochastics), as it dropped from 52 to below 36 in about 2 weeks time (30% drop). Keep this stock in your radar.

Disclaimer : Trading stocks involves risk, this information should not be viewed as trading recommendations.

Have a nice evening !!!!

AC

Labels: ,

Bookmark and Share

Wednesday, October 25, 2006 

GOOG $500 Could be this week !!!!

Chart courtesy of stockcharts

Shares of GOOG today hit a new 52 week high at 488.50$. The technical chart show a continuation of the trend with MACD and RSI in the Bullish areas, the stock is in a strong bull market with both 50 day and 200 day moving average going up. In mild October 50 day moving average has crossed on top 200 day moving average, this was a great time to buy the stock. Now the stock could be prepare to assault the $500 mark.

That's All. Have a great evening !!!

AC


Bookmark and Share

Tuesday, October 24, 2006 

TZOO surged 20% today !!!!

Chart courtesy of stockcharts

Shares of TZOO Travelzoo Inc., an Internet media company jumped nearly 20%, after the company said that third-quarter net income doubled on growth in online advertising, net income rose to $4.6 million, or 28 cents per share, from $2.3 million, or 13 cents per share, a year earlier.
The technical chart shows a big jump today and stock breaking above 37.50$ resistance level, with MACD also rising. We should expect a retest of this level to run up again.

Disclaimer : Trading stocks involves risk, this information should not be viewed as trading recommendations.

That's All. Have a great evening !!!

AC


Labels: ,

Bookmark and Share

Monday, October 23, 2006 

Stock to watch for a possible breakout RUTH

Chart courtesy of stockcharts

AAPL is now approaching of the historical highs after broken today the $80 important level.

Chart courtesy of stockcharts

Shares of Ruth's Chris Steak House could be prepare to breakout a reverse H/S according to the technical chart, so keep this stock in your watchlist. Now with MACD above 0 and stock back above 50 day moving average the stock should be expected to move up and breakout the white line.

That's All. Have a nice evening !!!

AC

Labels: , , ,

Bookmark and Share

Friday, October 20, 2006 

Stock of the day : PMCS & RMBS

Chart courtesy of www.stockcharts.com ( click to enlarge )

Let's start with PMCS that had a very interesting move today after reported earnings last night.
The Daily chart shows that the stock is about to run up again as 13 day moving average cross above 50 day moving average with MACD above 0. Pay attention if the stock breakout the channel.

Chart courtesy of www.stockcharts.com ( click to enlarge )

Shares of the chipmaker RAMBUS ( RMBS ) drop 8% today to 16.71$ per share after the company failed to release its full quarterly results as scheduled, although it did release revenue figures that for the third quarter was $45.9 million, up 28 percent over the third quarter last year and down 6 percent from the previous quarter. In the daily chart the current technical trend shows that the stock has traded between 16 and 19 since the first of September and should have a potential big support at 16$ ( bottom of the channel ), also the stock still trading above the 50 day moving average.

That's All. Enjoy your weekend !!!!

AC

Labels: ,

Bookmark and Share

Thursday, October 19, 2006 

Stock to watch tomorrow GOOG

Chart courtesy of stockcharts

Google reported today after the close that third-quarter sales surged 70% and profit rose 92% as online ad revenue surged. After this news "earnings report" shares jump nearly 6% in after hours, .....WOW.....................Tomorrow could be a great day for technology stocks.

Thta's All. Have a nice evening !!!

AC

Bookmark and Share

Tuesday, October 17, 2006 

LVLT " Level 3 " is HOT !!!!! is on FIRE

Chart courtesy of www.stockcharts.com ( click to enlarge )

LVLT has broken out of a Bull Flag pennant setup with huge volume closing at 6.02$ 52 week high, I can say LVLT is on FIRE !!! In the daily we can see that Bullish MACD crossover, so keep it on your watchlist. Remenber " the trend is your friend until it ends ".

FCEL today have confirmed my previous post, market drop and FCEL UP , which suggest continuation of movement !!!

JDSU - Bad start for JDS Uniphase after the R/S , however the volume was very weak. I'm still confident in the stock, and we could see some potential upside from these values. Major support in the stock is now 16$ .

Disclaimer : Trading stocks involves risk, this information should not be viewed as trading recommendations.

That's All. Have a nice evening !!

AC

Labels: , ,

Bookmark and Share

Monday, October 16, 2006 

Chart of the day : FCEL "Fuelcell Energy "

Chart courtesy of www.stockcharts.com ( click to enlarge )

Shares of FCEL surged 4% today and closed near the highs of day at 7.45$.
FCEL is looking bullish at this point after breakout the downtrend line. In the technical daily chart the stock is poised for a rally with MACD back above 0 and K line on top of D line indicating a buy signal. Although I expect some continued stength in the coming days after today movement, remenber that this movement was followed by volume as show the chart. I believe that we have bottomed here and a new uptrend will begin. I will be playing to the longside now.

Disclaimer : Trading stocks involves risk, this information should not be viewed as trading recommendations.

That's All. Have a nice evening !!

AC

Labels: , ,

Bookmark and Share

Thursday, October 12, 2006 

Dow Passes 11900 !!! Buuullllllssssssssss


Chart courtesy of stockcharts

The Dow Jones Industrial Average closed up 96 points at 11,948.
Buy ! Buy ! was the word on the street, markets continue very strong even trading in Overbought conditions.
Stocks pushed higher again today after some positive corporate news, the world's largest fast-food McDonald's Corp "MCD" said its third-quarter profit would top Wall Street's expectation. Dow is only a 52 points of 12000 !!! Tomorrow perhaps it'll passe.

That's All. Have a nice evening.

AC

Bookmark and Share

Wednesday, October 11, 2006 

RNWK hits a new year High !!!


Shares of RealNetworks Inc. hit a new 52-week high at 11.81$ today on the release of a music player designed to work exclusively with the company's Rhapsody music subscription service as the company bids to compete with the dominant iTunes/iPod duo from Apple. In the daily chart we can see that all indicators are showing Bullish signals, and probably tomorrow we'll see another year high, Keep an eye on it..........

Disclaimer : Trading stocks involves risk, this information should not be viewed as trading recommendations.

That's All. Have a nice evening.

AC

Bookmark and Share

Tuesday, October 10, 2006 

6.20 a key support for PWAV ?

Chart courtesy of www.stockcharts.com ( click to enlarge )

Shares of Powerwave Technologies tumbled Monday and during today session after the wireless communications equipment maker warned yesterday of a significant third-quarter sales miss, because of delayed production and shipments. The stock touched today in a new 52-week low at $6.17.
The stock is weak as MACD is below 0 and the stock is below 50 day and 200 day MA, however the stock has a important support at 6.20.

Disclaimer : Trading stocks involves risk, this information should not be viewed as trading recommendations.

That's All. Have a nice evening.

AC

Bookmark and Share

Monday, October 09, 2006 

Stock of the day : PEIX

Chart courtesy of www.stockcharts.com ( click to enlarge )

Shares of Pacific Ethanol Inc. surged 10% to 13.87$ per share after the company on Monday said that it will start production at its first ethanol production facility at Madera, California on Oct. 17. The technical daily chart indicates a potential up movement for stock, MACD fast line it's near to cross the MACD slow line, also this movement was followed by a big volume, which suggest a continuation of this movement.
Keep this stock in your wacth list.

Disclaimer : Trading stocks involves risk, this information should not be viewed as trading recommendations.

That's All. Have a nice evening.

AC

Bookmark and Share

Friday, October 06, 2006 

It's time to celebrate one year of existence ;-)


Dear All,


Ac Investor Blog was created on 08-10-2005 with the propose to print here my trade ideas of some stocks trading on Nyse and Nasdaq, however I never thought that after one year I will have more than 21000 visitors, with a average of 60 visitors by day, so I would like take this moment to thank you all for your visit.
Thank you so much and see you Monday with more Trade Ideas.............enjoy your weekend !!!!

That's All. Have a great weekend !!!

AC

Bookmark and Share

Thursday, October 05, 2006 

RNWK - Breakout the ascending triangle !!!!

Chart courtesy of stockcharts

Shares of Realnetworks hit new high today closing at 11.40 +4.50% after the company said it has joined with big-box retailer Best Buy to launch a new Best Buy-branded digital music store powered by Real's Rhapsody digital subscription service. The online component of the package, titled Best Buy Digital Music Store, is being done through a partnership with RealNetworks Inc.'s Rhapsody music service.
The technical chart above show that the stock is now in a rally after breakout today a key resistance level ($11) with big volume, also the overall technical picture show that the stock still in Bull market trading above 50 day and 200 day moving average. It'll be not a surprise if we see at this level a big short covering, because exist a high level of shorts.

Disclaimer : Trading stocks involves risk, this information should not be viewed as trading recommendations.

That's All. Have a great evening.

AC

Bookmark and Share

Wednesday, October 04, 2006 

JDSU - Big volume in the last hour

Chart courtesy of stockcharts

Shares of fiber optic network equipment maker JDSU added 2% to 2.24. In the last hour the stock jumped from 2.19 to 2.23 in minutes followed by volume. The technical chart is showing bullish sign as MCAD is above 0 and the stock back above 13 day moving average, we may finally see some positive momentum coming from the stock which has been beaten badly since September after the earnings report.

Disclaimer : Trading stocks involves risk, this information should not be viewed as trading recommendations.

That's All. Have a great evening.

AC


Bookmark and Share

Tuesday, October 03, 2006 

Chart of the day : MCD

Chart courtesy of stockcharts

Shares of MCD pullback again today after have touched near the highs with a huge volume, so probably we are seing some distribution at these levels, pay attention before entry long here, however overall the stock is still in a bull market as the stock is above 50 day and 200 day moving average.

Disclaimer : Trading stocks involves risk, this information should not be viewed as trading recommendations.

That's All. Have a great evening.

AC

Bookmark and Share

Monday, October 02, 2006 

ERTS has broken down the trend

Chart courtesy of www.stockcharts.com ( click to enlarge )

ERTS had a huge move today on volume and stock price and according to the daily chart above, the stock looks like it is has broken down the uptrend that have formed since july. "The trend is your friend until it ends". , also Bearish MA crossover.

Disclaimer : Trading stocks involves risk, this information should not be viewed as trading recommendations.

That's All. Have a great evening.

AC

Bookmark and Share
Contact

About Me

    Photobucket
  • I'm a 48 year old Independent Trader using proprietary technical analysis with more than 20 years experience of investing in the US stock markets. I started this blog in 2006 simply as a way to share my thoughts about capital, risk management, and trading. My blog contains only my personal opinion and is provided for informational purposes only.

  • Benzinga.com supporter

    Benzinga.com supporter


    FREE NEWSLETTER

      Enter your email address:

      Delivered by FeedBurner

      Subscribe my feed :

    Support AC

    • Support AC Investor Blog, Donate with PayPal

    Advertising

      Interested in advertising on AC Investor Blog ? Click Here

    TRANSLATOR

    Site Information

    Stock Market Blogroll

    Friends BLOGROLL

    ARCHIVES

Powered by Blogger
and Blogger Templates


Add to Google