-Financial Tools Futures Market--TRADE IDEAS-- OPTION ALERTS -BENZINGA PRO-

Saturday, May 27, 2006 

Can we believe in this bounce ?


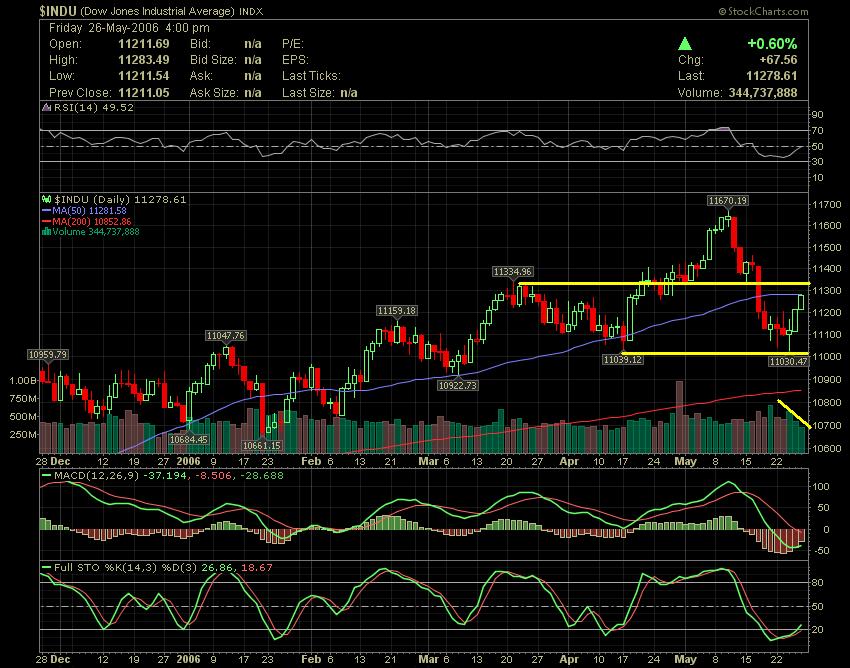
Major US Indices rebound this week after two weeks of Sell Off.
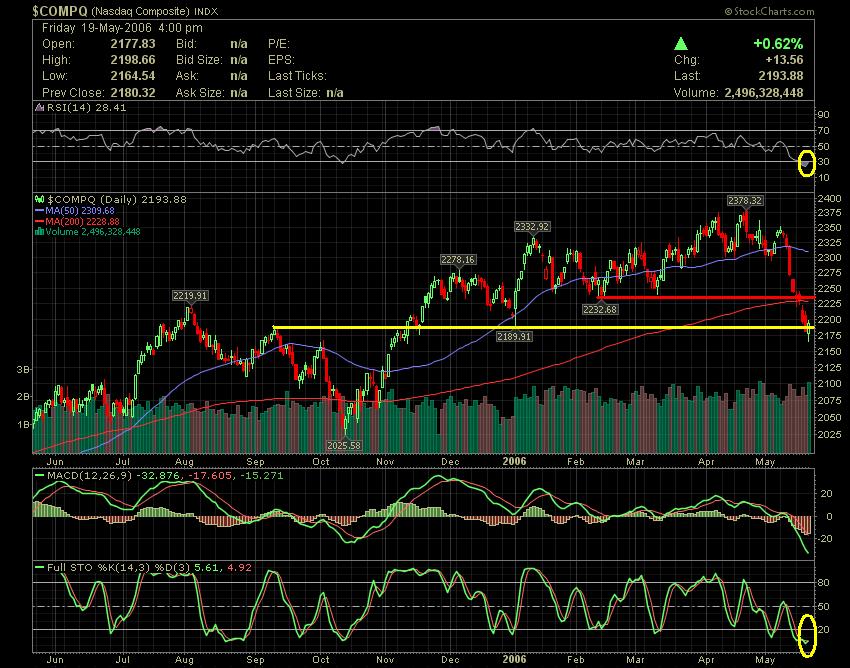
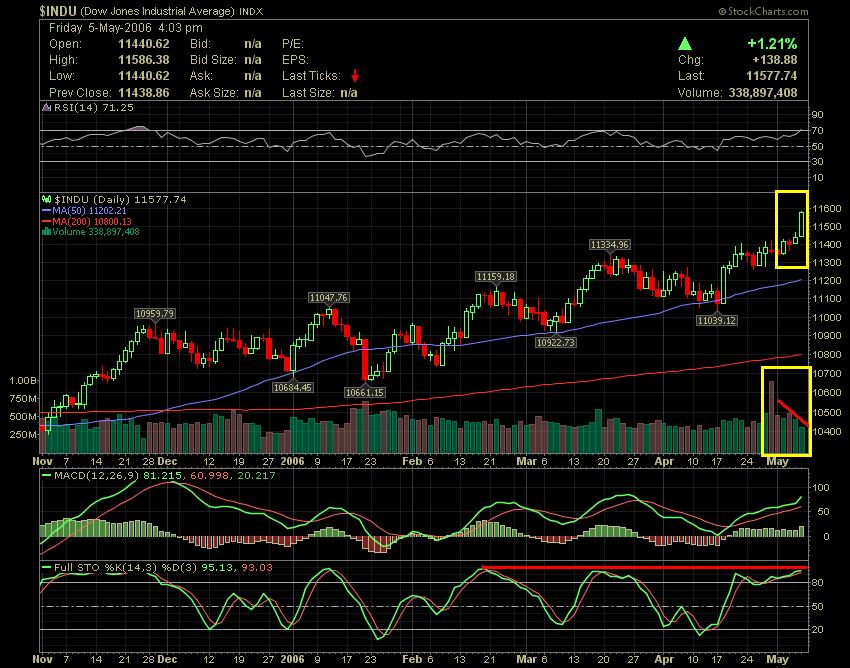
U.S. stocks closed higher for a third straight session Friday, posting a gain for the week, The Dow Jones Industrial rose 67.56 points, or 0.6%, to 11,278.61, Nasdaq Composite Index climbed 12.13 points, or 0.6%, to 2,210.37. For the week the Nasdaq gained 0.8%, the Dow rose 1.2% and the S&P 500 advanced 1%.
This rebound can be only technical bounce, because we need to see more volume to believe in a reversal trend and if we check the last two days of trading we see that this upside movements was followed by weak volume, so we need to have more careful now.

Rebound with weak volume in the last two sessions of trading.

Crude-oil futures posted a slight gain, ending the week with more than $2 a barrel higher.
According to the chart, we can see that the crude Oil didn't break the bottom of the channel.


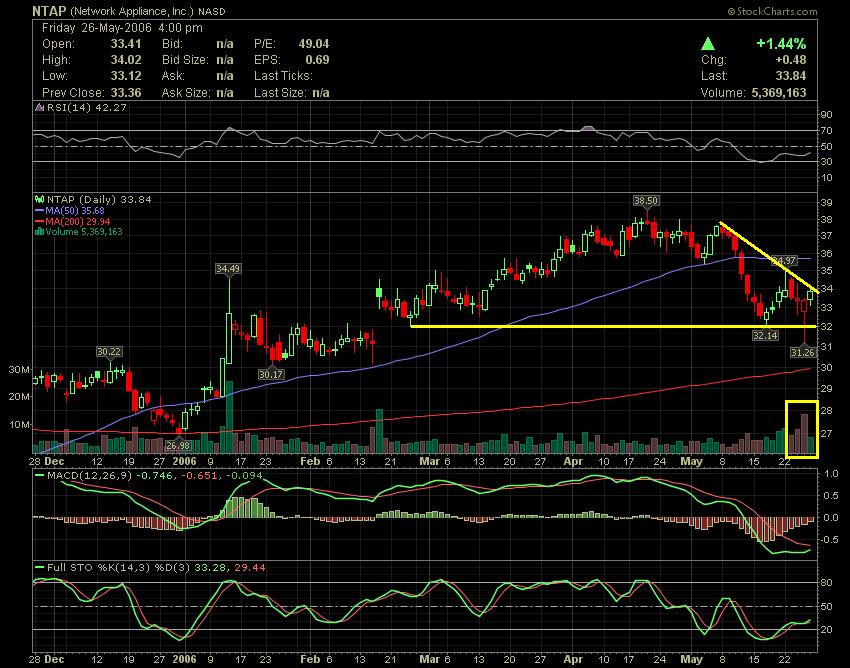
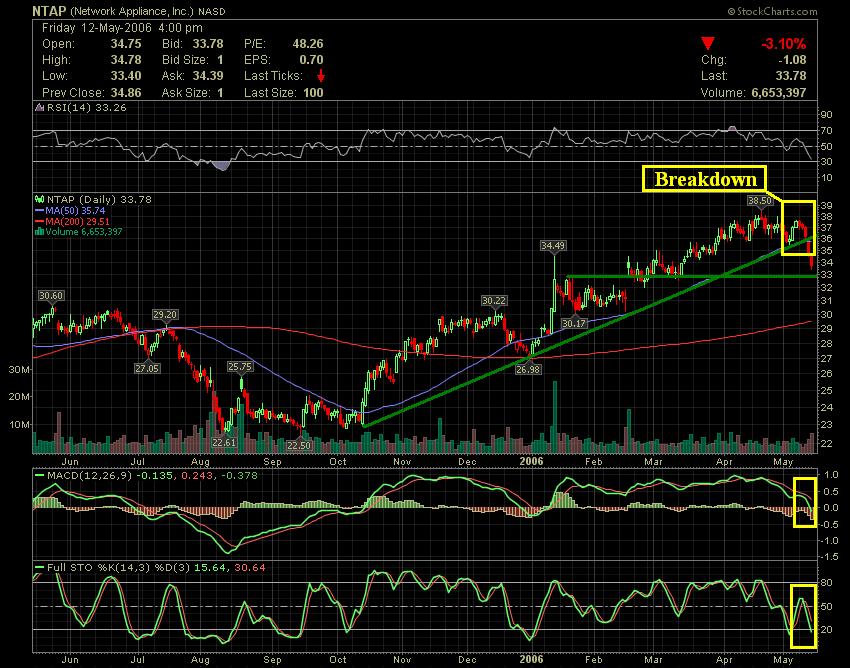
NTAP on Wednesday after the market close reported that its fourth-quarter net income dropped more than 6 percent to $59.2 million, or 15 cents a share, that compares to a net income of $63.4 million, or 16 cents a share, in the same period last year, Looking ahead, the company expects first-quarter earnings to be 13 cents to 16 cents a share, with a 2 percent to 4 percent growth in revenue. According to chart above we can see some bounce after the earnings report, but it's still trading in a short downtrend, so $34 can be a problematic resistance to break.


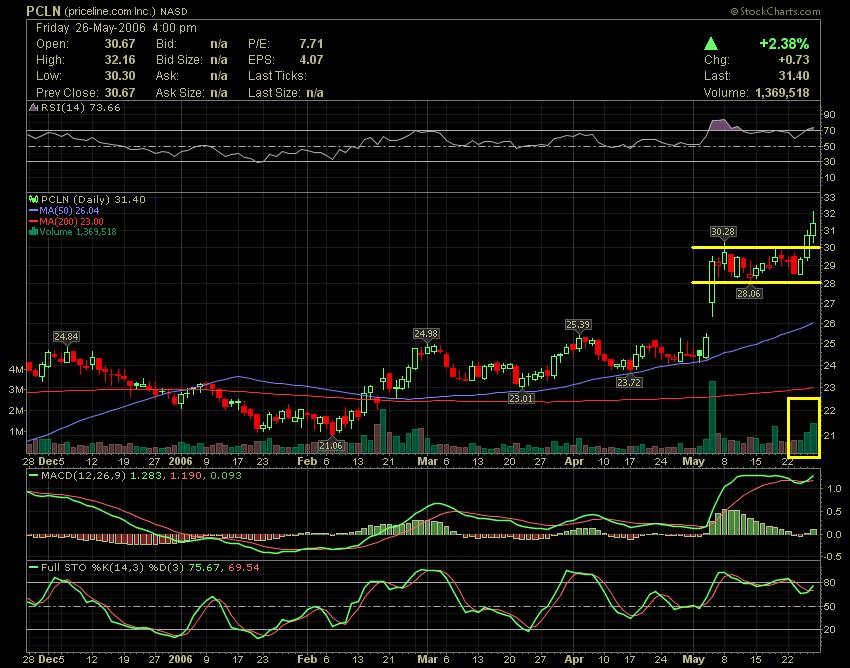
During this week PCLN stock have demonstrated very strength in the upside movements and breaking out of a Bull flag pattern that it had formed since the start of May with a very good volume. Bull flag is a sharp, strong volume rally on a positive fundamental development, several days of sideways to lower price action on much weaker volume followed by a second, sharp rally to new highs on strong volume.

That's All. Have a great weekend and a great week of business.

AC

Bookmark and Share

Saturday, May 20, 2006 

Time for a rebound !! Stocks in oversold conditions....

Chart courtesy of stockcharts.com

Oil prices fell on Friday after Iran's minister to OPEC said the group was not likely to cut production at its June meeting despite signs of surplus supply in the market, this news push the crude Oil until the bottom of the channel formed since April.

Chart courtesy of stockcharts.com

During this week we attended a big losses around the world in some markets of reference, some of these losses exceeded 5% on only one week. The reference aupports was broken very easy without any kind of indecisions, so next week can be a week of volatility and reflection face this wave of instability, and I think that the markets can rebound from these levels, however ba carefull. The last session of Nasdaq did a white candle with a good volume showed some strength at the end of session, so we can see some light in the tunel perhaps the red line resistance "MM200".

Chart courtesy of stockcharts.com

JDSU has held above the red line MM200 as a support, also the Oversold conditions doesn't have pressured the stock to break the mm200, so we can have some rebound from this levels perhaps until the next resistance at 2.96.

Chart courtesy of stockcharts.com

SWKS Looks like it started to get a technical bounce on Friday after having fallen 10 consecutive sessions. According to chart above we can see that the stock is now trying to leave of Oversold conditions.
Resistance : $5.95
Supports : $ 5.75 and $5.66

Chart courtesy of stockcharts.com

ATML looks like it may get a bounce here after tested the support 4.25 with success , also the recent clandlestick analysis show a Bullish signal.
First resistance : $4.40 next resistance $4.85
First Support : $4.25 next $3.70

That's All. Have a great weekend and a good business week.

AC

Bookmark and Share

Friday, May 12, 2006 

Bad week for mostly stocks " Bears on the table"

Chart courtesy of stockcharts

U.S. stocks closed lower on the day and week Friday, with the Nasdaq Composite at its weakest level since mid-February. The Dow Jones Industrial closed down 119.74 points to 11.380 and the Nasdaq Composite Index fell 28.92 points to 2,243.78, it weakest close since February 13.

I have focused in the last post the fact that the dowjones breakout LT was done with a small volume and the volume have decreased session after saession before the breakout, also I mentioned the fact of the Overbought conditions that the market have reached, so all these factors together ( not only ) have contribuied for the recent Sell Off also linked to the inflation fears.

Macro economic news reported on Friday :

- The Labor Departement said U.S. import prices jumped by 2.1 % in April. The increase resulted from the biggest jump in imported petroleum costs in more thatn a year.
- The Preliminnary May consumer sentiment fall to 79 from 87.4 in prior month.
- U.S. trade deficit narrowed unexpectedly to $62 billion in March from $65.64 billion in the prior month.

Chart courtesy of stockcharts

The Philadelphia semicondutor index closed the week under the support of its MM200 and during the friday session showed some resistance to break this line, this could be a strenght for Bulls for the week ahead.

Chart courtesy of stockcharts

Ascending triangle breakdown in INFA stock , potencial short position.

Chart courtesy of stockcharts

Ugly week for BRCM, but according to the chart above I think the Sell pressure it's done. According to chart above some indicators shows some exhaustion ( Oversold conditions ) in the descending direction, so now perhaps we can have some fresh air to go up.
Important note : the stock touched in the MM200 but doesn't break.

Chart courtesy of stockcharts

NTAP during this week breakdown the uptrend line with a signficant increase in the volume, all indicators are Bearishs however it's very near to reach the oversold conditions, from here the stock can react to the upside.

That's All. Have a great weekend !!!!

Good Business !!

AC

Bookmark and Share

Friday, May 05, 2006 

Dowjones , ATI , PEIX ( Ethanol ) , BRCM , JDSU

Chart courtesy of stockcharts

Dowjones Industrials closed today with a gain of 138 points to a new six-year high.
The Labor Department report a smallest payrolls grow, added just 138.000 in April, the slowest pace of grow since October, Wall Street analysts had expected 200.000. The Government also revised down March job growth.
Dowjones it's now only a 200 points of the Record High.
Remark : According to chart above we can see that today upside movement it was not followed by a good volume, also during the three last sessions the volume has decreased significantly, so next week the market has to confirm this trend.

Chart courtesy of stockcharts

The graphics-chip maker ATI Tecnologies one of the best stock performance of Nasdaq announced during this week a strategic relationship with Nokia Corp, ATI said that the companies are working together to enhance multimedia experiences, such as music playback, 3D gamimg, mobile television and video on Nokia devices, this news can add an impact significantly in ATI's fiscal 2007 earnings and revenue.

Chart courtesy of stockcharts

PEIX ( Pacific Ethanol, Inc. ) is an ethanol stock that it surprised the investors with an excellent valuation on April followed by an anormal volume. This week the stock breakout the ascending triangle but we need more sessions to confirm this upside movement, perhaps more two sessions.

Chart courtesy of stockcharts

BRCM is trading in a downtrend channel, during this week the stock have tested many times the $42 resistance ( yellow line ) level but without success, friday session was another example of weakness.

Chart courtesy of stockcharts

JDSU reported on Thursday the first profit since 1999 but the stock fell sharply after the company give a flat revenue guidance for the current quarter. According to chart above we can see a descending triangle in the JDSU stock, and show Bearish Signals all over the place ( RSI , MACD and finally the fullstochasthic ), 3.24 can be a good support for stock.

Friday after-hours hot stock : SGG

That's All. Have a great weekend !!!

AC

Bookmark and Share
Contact

About Me

    Photobucket
  • I'm a 48 year old Independent Trader using proprietary technical analysis with more than 20 years experience of investing in the US stock markets. I started this blog in 2006 simply as a way to share my thoughts about capital, risk management, and trading. My blog contains only my personal opinion and is provided for informational purposes only.

  • Benzinga.com supporter

    Benzinga.com supporter


    FREE NEWSLETTER

      Enter your email address:

      Delivered by FeedBurner

      Subscribe my feed :

    Support AC

    • Support AC Investor Blog, Donate with PayPal

    Advertising

      Interested in advertising on AC Investor Blog ? Click Here

    TRANSLATOR

    Site Information

    Stock Market Blogroll

    Friends BLOGROLL

    ARCHIVES

Powered by Blogger
and Blogger Templates


Add to Google