Dearest readers,
I wanna start by thanking all of you for following me on Twitter. Last week I achieved one of my main goals for this year by reaching the fantastic milestone of 100000 on Twitter. I can't thank you enough for your continued support, you guys are the best.
Trading stocks is not easy for beginners or professionals, it is really very hard and requires a lot of attention and knowledge. If stock trading was easy, everyone would be doing it. You can be successful at the stock market, with patience, discipline and a good trade set-up. The key objective is to make money and not lose it. Do not be hasty to buy or sell a stock, every day there are new opportunities to make money. Being patient is the key to the success of any trader.
( click to enlarge )
Virios Therapeutics LLC (NASDAQ:VIRI) has been falling since the first trading day from over $16.5 to $6.45 and finally it seems to be bottoming. Last week broke the primary downtrend line on decent volume is now touching the $8 area resistance that it should be broken very soon. I have been accumulating this stock for a run to $10.80 at least. If you haven't added VIRI to your watchlist, now is the time.
( click to enlarge )
Vislink Technologies Inc (NASDAQ:VISL) broke on Friday above its recent high and rose to $3.86 hitting the highest price in seven months. Further rally could be seen to retest $4.5 long-term resistance. As long as the stock stays above the EMA200 located now 2.42, the bullish scenario is still intact. Technical chart shows bullish sign with %K line on top of %D line and MACD on top of signal line. Next targets for the stock are $4.5 and $4.62. Only a close below $2.86 (9-day EMA) reverses the current short-term uptrend. Now that the stock is above the major resistance more buyers should be coming. Long setup on watch.
( click to enlarge )
Strong reversal Friday on heavy volume, forming a nice big bullish hammer candle. Such a bullish candle is a signal that the momentum is reversing, so the downside price action is limited. The next level to watch is now: $13.5, breaking that level should initiate a new buying wave up to 14.50
( click to enlarge )
Sellas Life Sciences Group Inc (NASDAQ:SLS) After a solid breakout on rising volume SLS has pulled back to support near $9 and should set up for its next upside move. Things are now beginning to turn in favor of the Bulls. The MACD confirms the recent jump and daily RSI also shows that there's more upside to come. SLS should be watched closely, it could pay off big if it shoots up from its current level. Keep a close eye on SLS because once it does move, it should be a good one.
( click to enlarge )
MARPS was up on Friday and I am keeping it on the list for next week. With the continued rise in oil prices, this small energy and low float play could see another big push to $9 On my fireworks list.
( click to enlarge )
Professional Diversity Network, Inc. (NASDAQ:IPDN) failed to continue its bearish correction on Friday showing inclusive relative strength. On the daily chart above we can see that the price is now testing the major key resistance level indicating a critical phase. A break above the resistance could trigger further bullish pressure testing 3.3/3.40 region and could potentially end this large sideways trading range. Im long before it explodes higher.
( click to enlarge )
BlackBerry (NYSE:BB) has been recovering from its recent sell off and might accelerate the short-term momentum further towards its next major hurdle near the 14 mark with some intermediate resistance near the 13.67 Key hourly momentum indicators continue to show positive trends.
( click to enlarge )
Akerna Corp (NASDAQ:KERN) The stock had a nice breakout and I am looking for it to continue next week. Any pullback to pivot is buyable.
( click to enlarge )
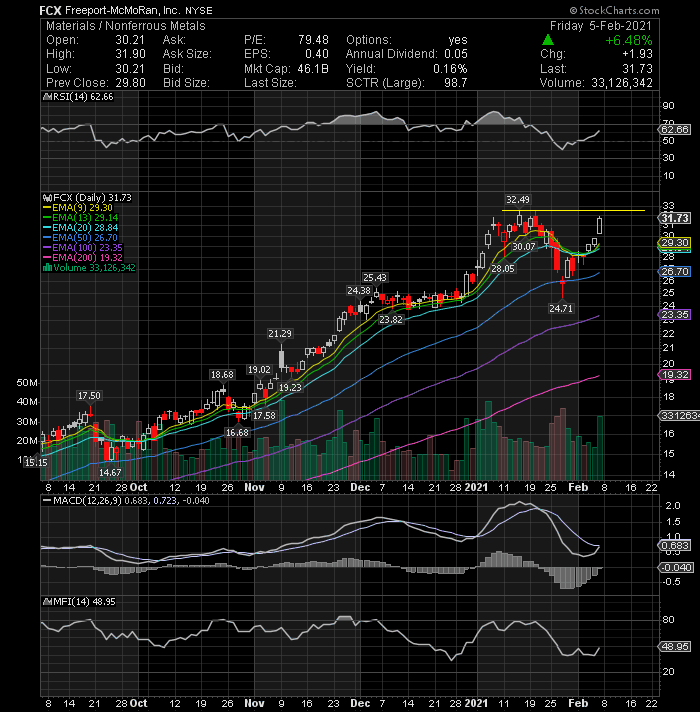
Freeport-McMoRan (NYSE:FCX) Resistance remains at $32.5 and I would be a buyer on a break above that level for a trade.
( click to enlarge )
Castor Maritime Inc (NASDAQ:CTRM) made a strong upside reversal Friday on heavy volume. Expect an initial run up to 90c with a break higher moving to the $1.2 zone. SL 60c
( click to enlarge )
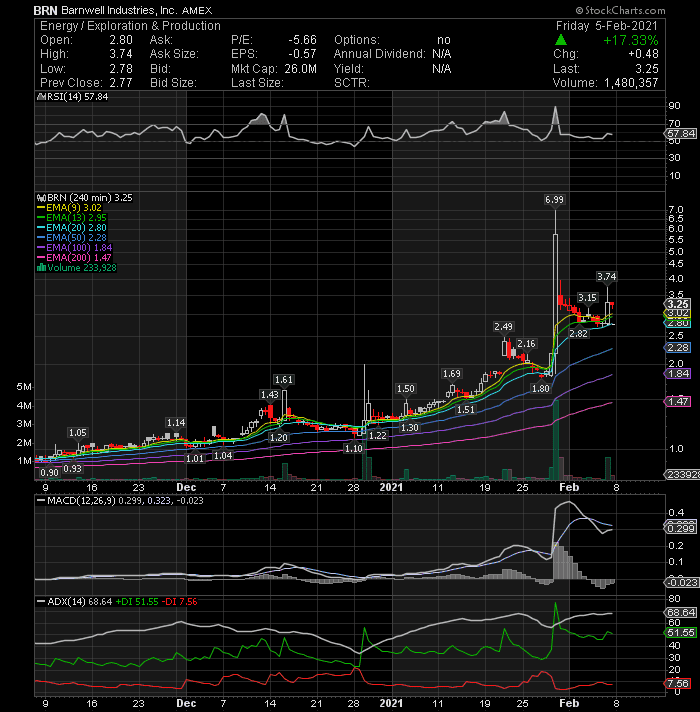
I've alerted my Stocktwits/Twitter followers about the potential upside movement in BRN shares on Friday morning one hour after the opening bell around the 2.85 level. The stock has come up to my expectations as it was among the top gainers of Nasdaq and closed up 17.33 percent at $3.25. These gains are really significant and represent substantial profit for investors who took advantage of my alert early, before the market caught on. The stock needs to take out the resistance at 3.74 to continue higher. Keeping it on the list.
( click to enlarge )
Coty, Inc. (NYSE:COTY) waiting for a break above the 7.86 level for a long position. The stock is up against a lateral resistance level and expected to break out. COTY just turned bullish on charts. Daily MACD is positive and above the signal line. RSI is also moving up and above its 50% level. I think the stock has room to go higher.
During the day I tweet many times to my readers. I encourage everybody to subscribe AC Investor Blog twitter and newsletter, so you can receive my trade ideas and stock news in real time.
Disclaimer : This is not an investment advisory, and should not be used to make investment decisions. Information in AC Investor Blog is often opinionated and should be considered for information purposes only. No stock exchange anywhere has approved or disapproved of the information contained herein. There is no express or implied solicitation to buy or sell securities. The charts provided here are not meant for investment purposes and only serve as technical examples. Don't consider buying or selling any stock without conducting your own due diligence.
Thanks for visiting AC Investor Blog.
AC
Labels: BB, BRN, CLOV, COTY, CTRM, FCX, IPDN, KERN, MARPS, SLS, VIRI, VISL