-Financial Tools Futures Market--TRADE IDEAS-- OPTION ALERTS -BENZINGA PRO-

Monday, June 15, 2015 

Stocks to keep an eye on June 16, 2015

( click to enlarge )

Zulily Inc (NASDAQ:ZU) broke out of a small consolidation pattern on High volume and could eventually rally up to test its recent high. Looking at the daily technical daily chart the near-term outlook is positive. ADX is starting to point up. The Relative Strength Index is also moving higher, which is a sign of growing strength in the stock and MACD is also giving a positive indication. ZU will move quickly, so keep it on your screen on Tuesday.

( click to enlarge )

Ballard Power Systems Inc. (NASDAQ:BLDP) Could be a high flyer on breakout, look for a break and close above $2.5 to enter longs. Daily technical indicators are looking Bullish.

( click to enlarge )

Idera Pharmaceuticals Inc (NASDAQ:IDRA) I see a potential inverted head and shoulders pattern forming on daily charts. If the stock price breaks out of the neckline, target level is around $5.20. My model is mixed with upside bias. For now lets wait for that break out to occur.

( click to enlarge )

Cyberark Software Ltd (NASDAQ:CYBR) established a new 52-week high today of 71.86, however in the final hour stock retracted closing at $70.83. Overall technical indicators are still in Bullishs areas. Let's see if tomorrow stock will confirm intraday breakout.

Disclaimer : This is not an investment advisory, and should not be used to make investment decisions. Information in AC Investor Blog is often opinionated and should be considered for information purposes only. No stock exchange anywhere has approved or disapproved of the information contained herein. There is no express or implied solicitation to buy or sell securities. The charts provided here are not meant for investment purposes and only serve as technical examples. Don't consider buying or selling any stock without conducting your own due diligence.

Thanks for visiting AC Investor Blog.

AC

Labels: , , ,

Bookmark and Share

Monday, May 11, 2015 

Stocks to keep an eye on May 12, 2015

( click to enlarge )

XOMA Corp (NASDAQ:XOMA) has already recouped its recent losses and looks poised to break resistance at $3.99. The near-term outlook stays cautious till the stock closes conclusively above this zone. So far the technical daily chart is still showing buy signal with stock trading above all short-term EMAs with MACD on top of signal line and RSI above its 50% level. In addition, we are seing some serious upside volume coming into this stock over the last few days. Short-term traders can hold their longs with a stop at $3.45

( click to enlarge )

BlackBerry Ltd (NASDAQ:BBRY) finished the session with a gain of 58 cents, or 5.92%, on higher-than-average volume, closing near the session high. This is a clear indication that current momentum could continue in the next few trading days toward the 11-11.2 area. Watch BBRY trade tomorrow since the stock has solid fundamentals and technicals suggesting that share prices could be continue on an upwards path, especially in the near-term.

( click to enlarge )

Cyberark Software Ltd (NASDAQ:CYBR) may test key support (50EMA) in the low $60s. The short-term exponential moving averages are starting to turn down and we are close to getting a bearish cross. In addition, the MACD is displaying a negative divergence and RSI is slipping in the neutral.

( click to enlarge )

Oclaro, Inc. (NASDAQ:OCLR) continues to hold the 100 and 200-day EMAs which is very bullish. I expect the stock to test the $2 level soon. A close over this level would be bullish and I'd expect the stock to run to $2.20.

( click to enlarge )

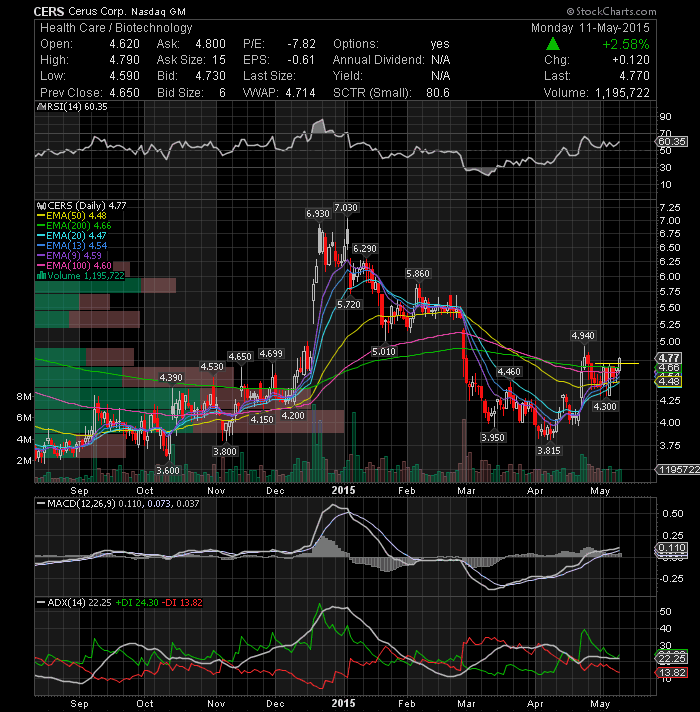
Cerus Corporation (NASDAQ:CERS) broke out above the 4.70 resistance level on decent volume today. I like the idea of getting long here with a stop below the 50-day EMA.


Disclaimer : This is not an investment advisory, and should not be used to make investment decisions. Information in AC Investor Blog is often opinionated and should be considered for information purposes only. No stock exchange anywhere has approved or disapproved of the information contained herein. There is no express or implied solicitation to buy or sell securities. The charts provided here are not meant for investment purposes and only serve as technical examples. Don't consider buying or selling any stock without conducting your own due diligence.

Thanks for visiting AC Investor Blog.

AC

Labels: , , , ,

Bookmark and Share

Thursday, May 07, 2015 

Stocks to keep an eye on May 08, 2015

( click to enlarge )

ZIOPHARM Oncology Inc.(NASDAQ:ZIOP) which has been trading in a falling wedge pattern for three weeks, broke out above the upper line and 50EMA today with a gain of 97 cents to 10.50. The move confirms the stock's reversal. Daily technical indicators such as MACD and CMF are also confirming the bullish price action. ZIOP is a short squeeze candidate, with a short float at 35% (equivalent to 11 days of average volume).

( click to enlarge )

The short-term outlook for Incontact Inc (NASDAQ:SAAS) looks promising from a technical point of view. Stock broke out of its falling wedge pattern on relatively high volume, and the breakout was accompanied by a bullish MACD crossover. Based on today's action, I expect to see the stock move up in the next coming days. Next major resistance lies at 11.60. Long setup.

( click to enlarge )

MEI Pharma Inc (NASDAQ:MEIP) was added to my watch-list as a possible bottom bounce-play. Daily technical chart is displaying positive divergences on momentum indicators and with the stock in oversold territory, these are the perfect conditions for a short-term rally. This stock can pop big time on any positive news. Stay tuned.

( click to enlarge )

Gevo, Inc. (NASDAQ:GEVO) traded massive volume on Friday and surged 122%. I will watch the stock tomorrow for a follow through move and have set resistance at $6.13 (200EMA).

( click to enlarge )

Twitter Inc (NYSE:TWTR) daily technical chart seems to have bottomed for now. The RSI is trying to move up from the oversold zone while the MACD and CMF are starting to turn up, signaling that a bounce is likely.

( click to enlarge )

Zynga Inc (NASDAQ:ZNGA) After over 4 weeks of remaining below its 200-day EMA, the stock could be in the early stages of a big rally. Today it moved higher, ending the day at $2.80 with strong volume. Next key resistance is now located at $2.90, a break above this level will confirm the bullish trend and the following uptrend will take price up to $3.2 zone.

Disclaimer : This is not an investment advisory, and should not be used to make investment decisions. Information in AC Investor Blog is often opinionated and should be considered for information purposes only. No stock exchange anywhere has approved or disapproved of the information contained herein. There is no express or implied solicitation to buy or sell securities. The charts provided here are not meant for investment purposes and only serve as technical examples. Don't consider buying or selling any stock without conducting your own due diligence.

Thanks for visiting AC Investor Blog.

AC

Labels: , , , , ,

Bookmark and Share

Sunday, March 08, 2015 

Stocks to keep an eye on March 9, 2015

( click to enlarge )

Pacific Ethanol Inc (NASDAQ:PEIX) stock had a great week with a minor drop on Friday. It closed at $11.33 and has a 52-week high of $23.97. I used this pullback to add several positions. The resistance at $12.16 in my opinion is the key to unlocking this technical chart and getting the party started. With a break above this zone, you can see just how thin the technical chart becomes. The next key resistance is not until up at $15.57. Indicators are also strong indicating further upside for the stock. MACD is already above the zero-line and still has plenty of room to move before it retests the highs it put in, back in September. Along with this, just check out the uptrend of the MACD since late January. The RSI is in the power zone and A/D is clearly showing money moving into the stock as more investors start noticing this stock. PEIX could be on the verge of making a stronger move upwards and early entrants, could take advantage of this potential opportunity. Im long.

( click to enlarge )

On the hourly time frame, we can see that the stock is making lower highs and lower lows (bearish sign) since February 20 after reaching a high of 70.48. Additionally, it broke the second bear flag that has been formed in this downtrend. Key indicators suggest continuation of negative bias for the stock.

( click to enlarge )

Regado Biosciences Inc (NASDAQ:RGDO) closed very strong on Friday, above the January highs. The stock traded 3x normal daily volume, as buyers came rushing in. I like this Bio name and will watch it again on Monday. Resistance is $1.61, which was Friday’s high of the day. Technical daily chart shows bullish sign with RSI in the power zone and MACD on top of signal line. A decisive close above the 1.61 level on heavy volume, and, we could be looking at RGDO testing its next resistance level around the 200-day EMA at 2.18.

( click to enlarge )

Marvell Technology Group Ltd. (NASDAQ:MRVL) held up very well in a weak market on Friday, which is a good reason to keep a close eye on the stock. The way the it is trading, leads me to believe the price is going to make a big move up. In addition, the volume has been slowly picking up the last few trading sessions, which is another sign of a buyer in the stock. Keep an eye for a possible breakout over 16.78

( click to enlarge )

Amarin Corporation plc (NASDAQ:AMRN) had a very bullish move last week breaking several resistance lines with large volume and we should see a continuation move next week. The MACD chart is still showing an uptrend with the MACD indicator above its signal line and is indicating further strength. The RSI value is currently above 80% level but the past behavior shows that RSI can easily move to 90. The short-term trend is bullish and a move to the 1.9-2.05 range appears likely. AMRN has definitely changed the trend.

( click to enlarge )

Crossroads Systems Inc (NASDAQ:CRDS) declined to a support zone and upside volume is starting to pick up, watch resistance at $3.05. Fresh exposures may be considered on close above this level, with a stop-loss at $2.53

( click to enlarge )

ZIOPHARM Oncology Inc. (NASDAQ:ZIOP) This technical chart looks pretty bullish. The stock has been under strong accumulation since the beginning of October and is now working the overbought area. There is a need for profit taking for some consolidation from these high levels. The short-term outlook remains positive as long as the stock stays above the 9 & 13 EMAs.

Disclaimer : This is not an investment advisory, and should not be used to make investment decisions. Information in AC Investor Blog is often opinionated and should be considered for information purposes only. No stock exchange anywhere has approved or disapproved of the information contained herein. There is no express or implied solicitation to buy or sell securities. The charts provided here are not meant for investment purposes and only serve as technical examples. Don't consider buying or selling any stock without conducting your own due diligence.

Thanks for visiting AC Investor Blog.

AC

Labels: , , , , , ,

Bookmark and Share

Wednesday, March 04, 2015 

Stocks to keep an eye on March 5, 2015


( click to enlarge )

Netflix, Inc. (NASDAQ:NFLX) Broke the rising wedge this week and looking for another push down. Daily technical indicators are displaying negative divergences. MACD is still positive but falling rapidly below its signal line and RSI is about to drop below its 50% level. If it breaks below the 20-day EMA support line, we could see it go down to $428.

( click to enlarge )

Hemispherx BioPharma, Inc (NYSEMKT:HEB) The stock price has cleared its recent highs on its biggest volume in weeks. You can see in this daily chart by comparing the volume bar to the other volume bars. Large surges in volume should always raise an eyebrow, since volume is one of the best leading indicators for technical analysis. If it breaks and closes above the 200-day EMA tomorrow, next target will be 33c.

( click to enlarge )

Cyberark Software Ltd (NASDAQ:CYBR) The technical indicator MACD triggered a "sell" signal today and this stock looks primed for further losses JMHO. Look for the stock to continue to push lower and my target remains the same $52

( click to enlarge )

BioMarin Pharmaceutical Inc. (NASDAQ:BMRN) Setting up nicely for new highs. Daily technical indicators are bullish. Breakout watch over 111.89

( click to enlarge )

Sears Holdings Corp (NASDAQ:SHLD) broke out of a small consolidation range today but the volume was low. I will be watching the stock on Thursday for a continuation of this breakout.

( click to enlarge )

JetBlue Airways Corporation (NASDAQ:JBLU) Stalking as a potential swing long above 18.20

( click to enlarge )

Cliffs Natural Resources Inc (NYSE:CLF) I'm seeing some positive divergences in several indicators, but this are not confirmed yet, as prices have not shown a confirmed reversal. The stock needs to break the 50-day EMA to expect a strong rally at this point. The insiders are pretty bullish of the company with multiple purchases this week.

Disclaimer : This is not an investment advisory, and should not be used to make investment decisions. Information in AC Investor Blog is often opinionated and should be considered for information purposes only. No stock exchange anywhere has approved or disapproved of the information contained herein. There is no express or implied solicitation to buy or sell securities. The charts provided here are not meant for investment purposes and only serve as technical examples. Don't consider buying or selling any stock without conducting your own due diligence.

Thanks for visiting AC Investor Blog.

AC

Labels: , , , , , ,

Bookmark and Share

Saturday, February 28, 2015 

Stocks to keep an eye on March 2, 2015

( click to enlarge )

Cyberark Software (NASDAQ:CYBR) finally broke down from the bear flag formation highlighted on the daily chart, signaling further decline. The stock price shows weakness with its recent decline and could reach the potential target area at $52. The trajectories of momentum and directional indicators also point to continuation of negative bias. Based on fundamentals this stock is way overvalued. Short setup.

( click to enlarge )

Bonanza Creek Energy Inc (NYSE:BCEI) Shares ended the day down $2.29, or 7.83 percent, to close at $26.95 on heavy trading. Trendline support has been broken on the daily chart at $27.7 with the next target at $24.50. Technically speaking, it is now in a Bearish mode with MACD below signal line and the stock price below all major EMAs. I expect the stock to continue its downside movement. Short setup.

( click to enlarge )

VirnetX Holding Corporation (NYSEMKT:VHC) Still holding long position. From a technical perspective, the stock finally broke out above $7 a share last week with a strong volume expansion. It has a medium-term target of 9 and it could move a lot further especially given the high level of short interest. However, I think we are due for some kind of a pullback (overbought conditions), which could be a buying opportunity.

( click to enlarge )

BlackBerry Ltd (NASDAQ:BBRY) Strategy: Buy on dips. The stock closed at 10.81 on Friday in a weak session for techs, reconfirming the new uptrend after the recent break of the 10.5 resistance level on expanding volume. Because of this I feel that this stock is ready to go towards its next target of $11.11 level. Accordingly, I suggest to buy the stock on dips targeting $11.11 and +$12.50. The technical indicators are looking better for the stock. Chart shows a very bullish sign as the stock price is back on top of all EMAs moving average while the MACD is positive and rising. Long setup.

( click to enlarge )

Sunshine Heart Inc (NASDAQ:SSH) broke out of symmetrical triangle formation last week. From a technical standpoint, the stock is now very bullish with the breakout having a large spread and volume. We also have the MACD above zero line and RSI above 50% levels, indicating the stock is in a “bullish” trend. Any break above the $6-$6.20 range will push the prices toward the $6.90 to $7 area. Stop-loss 5. Long setup.

( click to enlarge )

Ibio Inc (NYSEMKT:IBIO) The stock went as high as $1.06 before closing the day at $1, up more than 3 percent on solid volume. From the technical daily chart above we can see that the stock is on a bull market as the stock is trading above all EMAs and MACD is above Zero line. Given the strength that we saw yesterday, it seems to me that the correction is nearing an end and the uptrend is about to resume. The stock may go up to 1.4 or more if it breaks next week the resistance at 1.08. I went long with a stop located at located at 86c (20EMA).

( click to enlarge )

salesforce (.) com, inc. (NYSE:CRM) had a very good bullish rally last week accompanied with large volume. A gap was formed also with good volume. It's now in the red line as RSI hit 80. It may still move up some + cents but I expect a correction any time as we have observed that a lot of indicators have already reached overbought conditions. $69 is the key support level.

( click to enlarge )

I alerted Second Sight Medical Products Inc (NASDAQ:EYES) to my twitter followers (TWITTER ALERT) before crowd when it was trading around the 8.85 level. Traders who saw the gold in my alert and took advantage of EYES 100% climb, then congratulations ! BRAVO !!! 

And lastly...I am also keeping a close eye on Hemispherx BioPharma, Inc (NYSEMKT:HEB) for the month of March (I own 60,000 shares of this right now). The company and the U.S. Army Medical Research Institute of Infectious Disease will present findings of new studies of Ampligen(R), an experimental therapeutic during the 7th Annual International Symposium on Filoviruses in Washington, DC, March 25-28.

Disclaimer : This is not an investment advisory, and should not be used to make investment decisions. Information in AC Investor Blog is often opinionated and should be considered for information purposes only. No stock exchange anywhere has approved or disapproved of the information contained herein. There is no express or implied solicitation to buy or sell securities. The charts provided here are not meant for investment purposes and only serve as technical examples. Don't consider buying or selling any stock without conducting your own due diligence.

Thanks for visiting AC Investor Blog.

AC

Labels: , , , , , , ,

Bookmark and Share

Thursday, February 26, 2015 

Stocks to keep an eye on February 27, 2015

( click to enlarge )

Cyberark Software Ltd (NASDAQ:CYBR) Watch this bear flag pattern for a break with a bias to the downside. Note that volumes have been sliding during the recent rally (since Tuesday). Rallies always require volume support to sustain. Daily technical indicators are also turning bearish. The MACD indicator is above its signal line but has stopped moving up. My initial target is $52

( click to enlarge )

Northrop Grumman Corporation (NYSE:NOC) Daily technical indicators are beginning to look a bit bearish to me. The MACD has crossed below its signal line and the stock closed below its 20-day EMA for the first time since Janury on decent volume. The pullback should continue, at least 157 should be possible.

( click to enlarge )

There seems to be no slow down in the short-term upward momentum of BlackBerry Ltd (NASDAQ:BBRY) stock. All major EMAs are rising and the stock is trading above them. Additionally, the MACD has made a rounding-bottom pattern to touch its signal line in positive territory and the RSI has crossed above its 50% level. Buying momentum is still positive and strengthening. On watch.

Disclaimer : This is not an investment advisory, and should not be used to make investment decisions. Information in AC Investor Blog is often opinionated and should be considered for information purposes only. No stock exchange anywhere has approved or disapproved of the information contained herein. There is no express or implied solicitation to buy or sell securities. The charts provided here are not meant for investment purposes and only serve as technical examples. Don't consider buying or selling any stock without conducting your own due diligence.

Thanks for visiting AC Investor Blog.

AC

Labels: , ,

Bookmark and Share
Contact

About Me

    Photobucket
  • I'm a 48 year old Independent Trader using proprietary technical analysis with more than 20 years experience of investing in the US stock markets. I started this blog in 2006 simply as a way to share my thoughts about capital, risk management, and trading. My blog contains only my personal opinion and is provided for informational purposes only.

  • Benzinga.com supporter

    Benzinga.com supporter


    FREE NEWSLETTER

      Enter your email address:

      Delivered by FeedBurner

      Subscribe my feed :

    Support AC

    • Support AC Investor Blog, Donate with PayPal

    Advertising

      Interested in advertising on AC Investor Blog ? Click Here

    TRANSLATOR

    Site Information

    Stock Market Blogroll

    Friends BLOGROLL

    ARCHIVES

Powered by Blogger
and Blogger Templates


Add to Google