Swing Trade Ideas for the coming week
Apologies for the lack of blog updates in the past couple of weeks. I will try to be more consistent in posting but make no promises. Managing family time on weekends with markets, it's not easy.

( click to enlarge )
I still own some bitcoins. The chart pattern is compressed and Bitcoin is coiling up for a larger move. Breakout watch over 17400

( click to enlarge )
In the short-term, Bank of America Corp (NYSE:BAC) is extremely oversold and sentiment is negative. It can be very hazardous to sell into this condition. The stock opened Friday`s session at $32.11 and intra-day was ranging at 32.60-32.08 ending the session with a small loss of 0.18%. I think the stock looks ripe for a rally from extremely oversold conditions.

( click to enlarge )
PayPal (NASDAQ:PYPL) is this a bullish flag 4 hour chart? Some positive divergences in the chart showing up. Only a close above the 75 level would confirm this view. The underlying primary trend remains down. I like Paypal at current levels (we are at 2018 levels).

( click to enlarge )
Chemomab Therapeutics Ltd (NASDAQ:CMMB) witnessed a follow-up buying with a surge in volume like in late May/early June. This could be the start of a nice rebound! With small cap stocks history tends to repeat itself. If you follow the market long enough and study the small cap stocks closely you can find many consistencies, the trends, and other helpful signs that can help you turn a profit. Watch the break of 2.50 next week for a potential new explosive move to the upside.

( click to enlarge )
SINTX Technologies Inc (NASDAQ:SINT) Over the past 4 weeks we've rallied up to 0.145 and now back down to 10c forming the right shoulder of the Inverted Head and Shoulders pattern. It has the potential to break out, as this is one of the most reliable trend reversal patterns. The stock price declined by approximately 80% over the last 3 months. Despite the significant losses, the stock seems to be developing a reversal pattern that could see its price improve. A decisive close above the $0.14 resistance level could push this penny towards 35c. When it comes to penny stocks, nothing is impossible, look what happened with AMAM on Friday with a 1000% gain.

( click to enlarge )
Digital Brands Group Inc (NASDAQ:DBGI) closed back above the downtrend line from mid-Nov highs on the hourly chart to confirm the bullish momentum divergence. The stock needs to break Friday's high of $4.4 to expect a strong rally at this point. Low float former runner.

( click to enlarge )
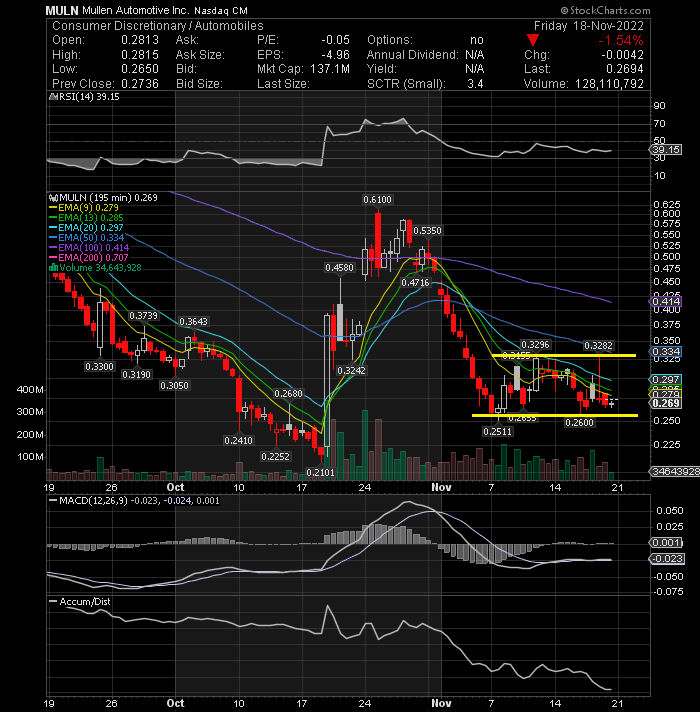
Mullen Automotive Inc (NASDAQ:MULN) is still in bottoming mode it looks like. The daily technical indicators are looking better now for the stock. A reversal may be on the way. Only a close below 18c will invalidate the current potential bottom scenario.

( click to enlarge )
Treasure Global Inc (NASDAQ:TGL) Basing. Breakout watch over 2.21

( click to enlarge )
I like Lucid Motors (NASDAQ:LCID) for a bounce play over 8.84 if the market gets a relief bounce.

( click to enlarge )
Smartsheet Inc (NYSE:SMAR) flagging. Breakout watch over 38.51
( click to enlarge )
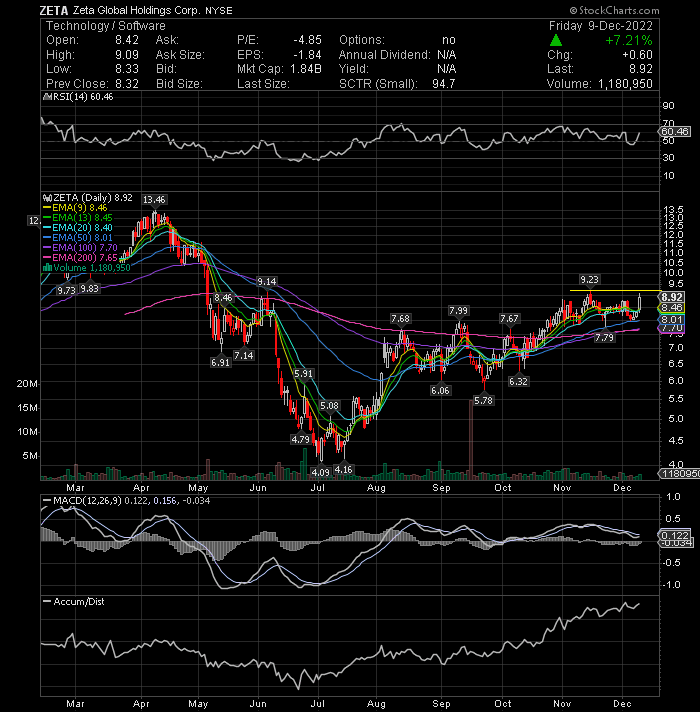
Zeta Global Holdings Corp (NYSE:ZETA) is setting up to break out and has one more level to go, which is $9.23
Disclaimer : This is not an investment advisory, and should not be used to make investment decisions. Information in AC Investor Blog is often opinionated and should be considered for information purposes only. No stock exchange anywhere has approved or disapproved of the information contained herein. There is no express or implied solicitation to buy or sell securities. The charts provided here are not meant for investment purposes and only serve as technical examples. Don't consider buying or selling any stock without conducting your own due diligence.
Thanks for visiting AC Investor Blog.
AC
Thanks for visiting AC Investor Blog.
AC
Labels: AMAM, BAC, CMMB, DBGI, LCID, MULN, PYPL, SINT, SMAR, TGL, ZETA
| Permalink | ![]()