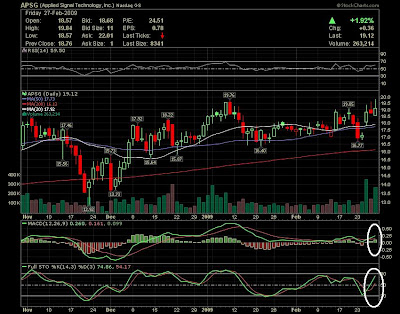
Chart courtesy of www.stockcharts.com ( click to enlarge )
APSG recorded a new high in the last trading session. Short-term outlook for the stock is bullish. Buy the stock in dips with a stop-loss at 18. The technical daily chart looks Bullish with both 20, 50 and 200 daily moving averages going up and MACD on top of 0, RSI in a Bullish area too. I'll be watching her carefully for any possible opportunities.

Chart courtesy of www.stockcharts.com ( click to enlarge )
BAX - Trendline support has been broken this week on the daily chart at $57 with the next target at $48. An aggressive trader may want to short BAX here. Technically, the stock is in a Bearish mode with MACD below signal line and the price below both 50 and 200 day moving averages. The stock has a key support level at $48.84. Buy only when the stock reverses from this support.

Chart courtesy of www.stockcharts.com ( click to enlarge )
KNSY - It looks like the buyers are finally aware of the buying opportunity at this level after the big drop occured on Thursday. On the daily chart we have an ascending channel indicating a short term bullish momentum.I note that the daily momentum indicator is displaying bearish divergence, which portends weakening in the bullish momentum. Immediate support is seen at 18.55. Initial resistance at 19.22.
Disclaimer : Trading stocks involves risk, this information should not be viewed as trading recommendations.The charts provided here are not meant for investment purposes and only serve as technical examples.
That's all Folks. Have a nice weekend.
AC
Labels: APSG, BAX, KNSY
 Chart courtesy of www.stockcharts.com ( click to enlarge )


