Chart courtesy of
stockcharts ( click to enlarge )
The stock moved in a range of $180 and $164 during the course of the past week. The stock faces now resistance at the $175 level ( 20 DMA ). The stock has formed a positive divergence pattern and we could see a rally on the stock, if it is able to move above the $175 level and if overall market sentiment for frontline tech stocks turns positive.

Chart courtesy of
stockcharts ( click to enlarge )
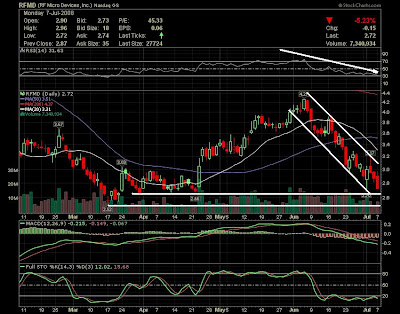
RFMD -As I had indicated in my last post, the RFMD stock corrected itself after last week’s fall to rise above the $3 level. The overall weakness on the bourses and especially in the tech sector has dramatically affected sentiment on the RF Micro Devices stock. The downward trend is likely to continue, with occasional bouts of corrections. Technically, the RFMD stock is displaying a bearish outlook and is likely to fall to a range of $2.66 to $2.52 in the short run.

Chart courtesy of
stockcharts ( click to enlarge )
TTEK has been trying to bottom for a couple of days now, but keeps pulling back further on weak market days. On Thursday the stock has fallen below its 200-day moving average, which is a negative sign. On the upside, it could test the $21.43 level and if it is able to move above this level successfully, we could see the stock post a rally. On the downside it would try to seek support at the $20 level, and later at the $18.94 level.
TRN - The stock is currently trading near its support of $31.05 ( 200 DMA ). If the stock trades above this level, then it might go to $34. However, if the stock declines below the support of $31.05, then it might go to $28.02. The stock is in a downtrend.
Disclaimer : Trading stocks involves risk, this information should not be viewed as trading recommendations.The charts provided here are not meant for investment purposes and only serve as technical examples.
That's All. See you tomorrow !!!
AC
Labels: AAPL, RFMD, TRN, TTEK
 Chart courtesy of stockcharts ( click to enlarge )
 Chart courtesy of stockcharts ( click to enlarge )
 Chart courtesy of stockcharts ( click to enlarge )


