Chart courtesy of
stockchartsGoogle is just a few dollars to hit $600, and I think it will break this level next week, all indicadions predict this scenario, it's my feeling.

Chart courtesy of
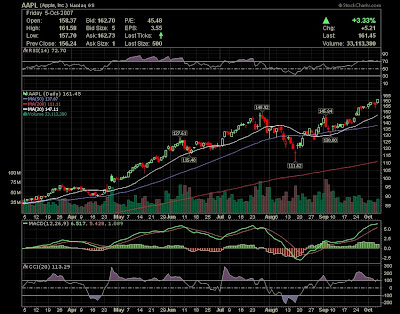
stockchartsShares of AAPLE were up on Friday nearly 4% or 4.42$ to $161.45, reaching during the regular session a new 52 week high at $161.58. The daily chart show a continuation of the trend with MACD and RSI in the Bullish areas, the stock is in a strong bull market with both 50 day and 200 day moving average going up, however in overbought conditions. Indicators are all in favor of Bulls with K line above D line and MACD back above 0.

Chart courtesy of
stockchartsCIEN had a huge breakout in the beginning of week, breaking $41 with a bombastic volume. At this level, I prefer wait for a pull back to buy again, due to the Overbought conditions.

Chart courtesy of
stockchartsRIMM shares jump more than 12% on Friday closing at $113.37, after company said its profit and sales doubled in the second quarter, and offered a better-than-expected third-quarter outlook. Stock broke out to all time highs today with a huge volume above daily average. Thechnically chart is looks extremelly Bullish, we should see the stock continue to go up in the weeks ahead, however a pull back due to overbought should appear naturally.
It looks like YHOO will continue trading within this rising channel, supported by recent news regarding Alibaba.com IPO. Important note for Bulls : For the first time since June stock close above its 200 dma, a strong Bullish sign.
Disclaimer : Trading stocks involves risk, this information should not be viewed as trading recommendations. The charts provided here are not meant for investment purposes and only serve as technical examples.
That's All. Have a nice weekend !!!
AC
Labels: AAPL, CIEN, GOOG, RIMM, YHOO
 Chart courtesy of stockcharts
 Chart courtesy of stockcharts
 Chart courtesy of stockcharts
 Chart courtesy of stockcharts


This comment has been removed by the author.
Posted by Shanon Sandquist |
2:08 AM
Hi AC !!
We've to consider your tips as a good opportunity. YHOO as a good example, like many others. So, tks for your good work !!!
Your reader,
Peter Smith
Posted by Anonymous |
3:03 PM