MSFT , GTW , AET , LRCX , earnings data
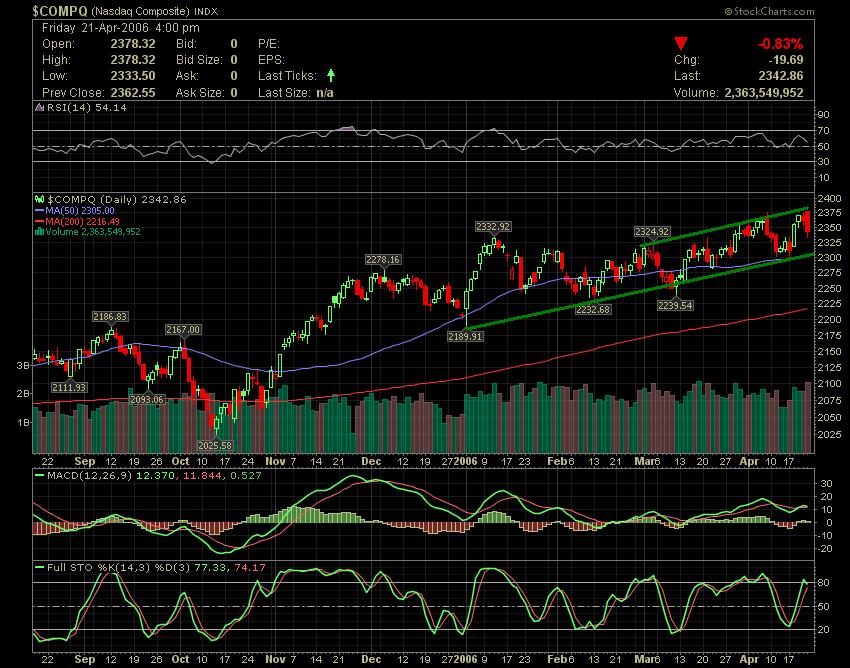
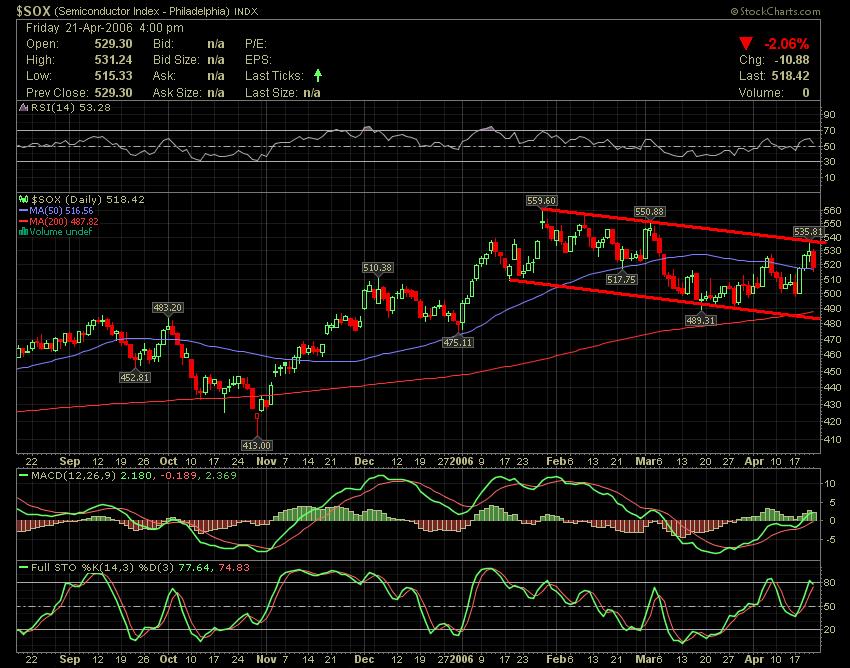
 Chart courtesy of stockcharts
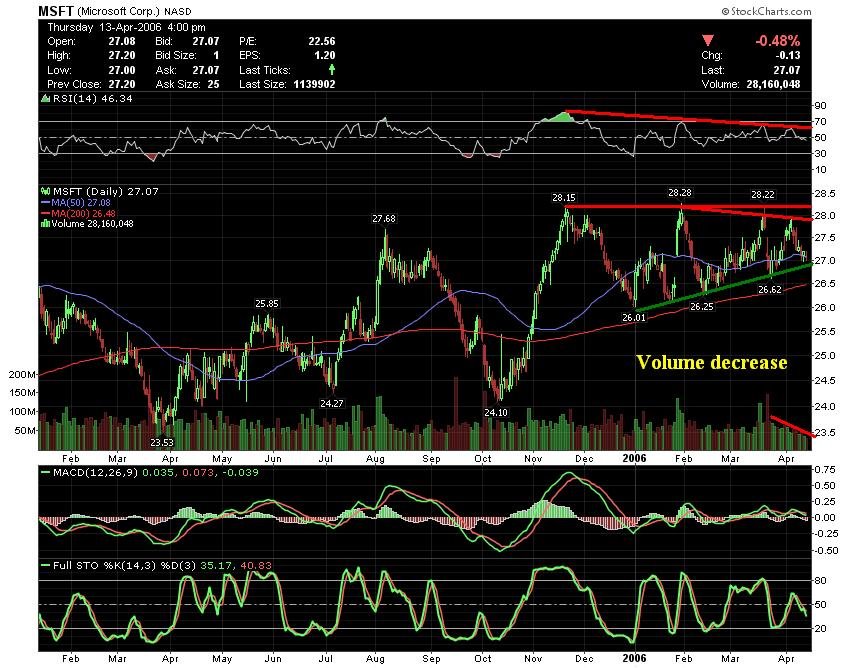
Microsoft said on thursday that its quartely income rose 16% , reported earnings of $2.98 Bilion or 29 cents per share, compared with $2.56 Bilion or 23 cents per share, in the same period a year earlier, The revenue for the three-month period was $10.9 Bilion, a 13% increase over sales of $9.62 Bilion a year earlier. Microsoft shares fell sharply today after reduced forecast, suffering their worst percentage fall since late 2000, with a volume that was the second highest in the stock's history.
 Chart courtesy of stockcharts
Gateway the third-largest U.S.
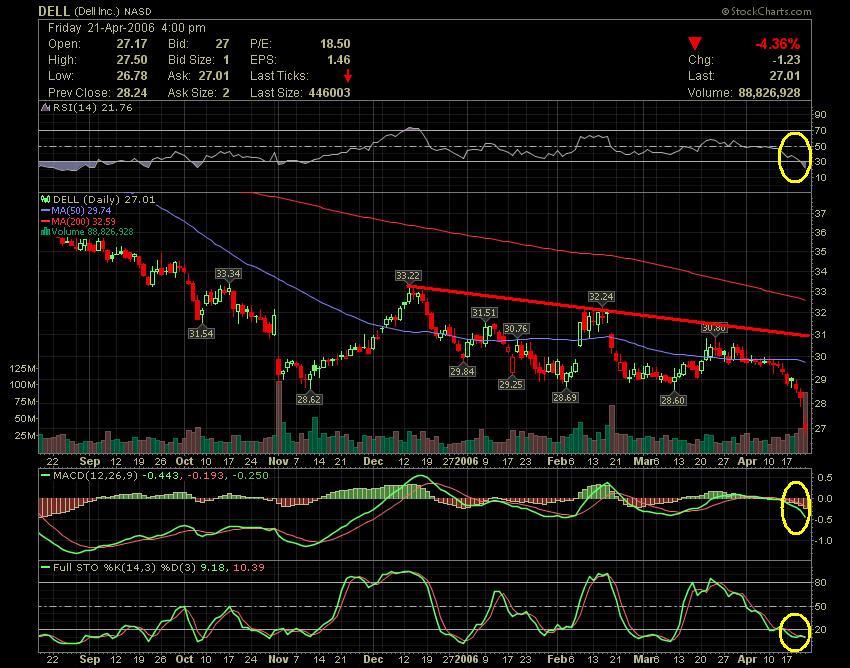
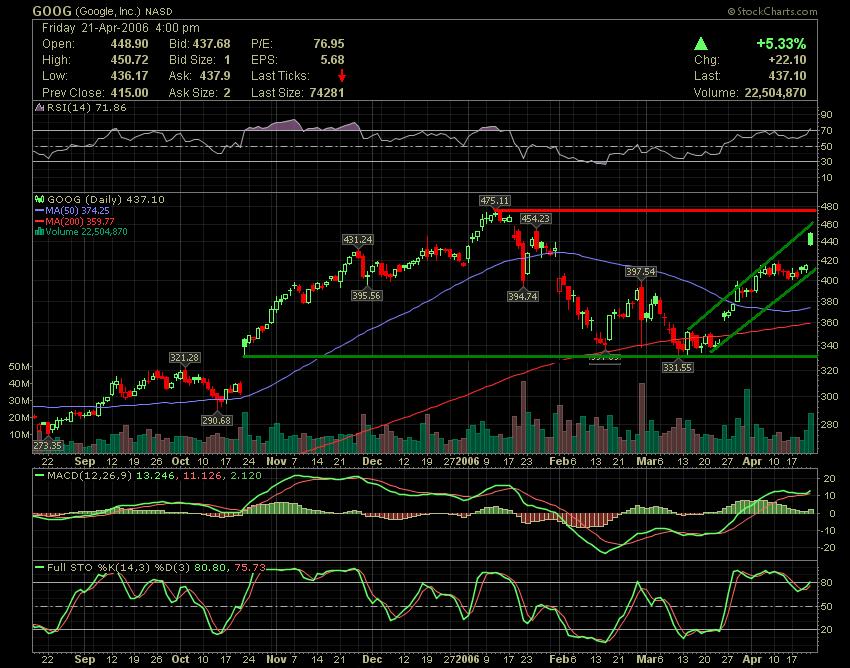
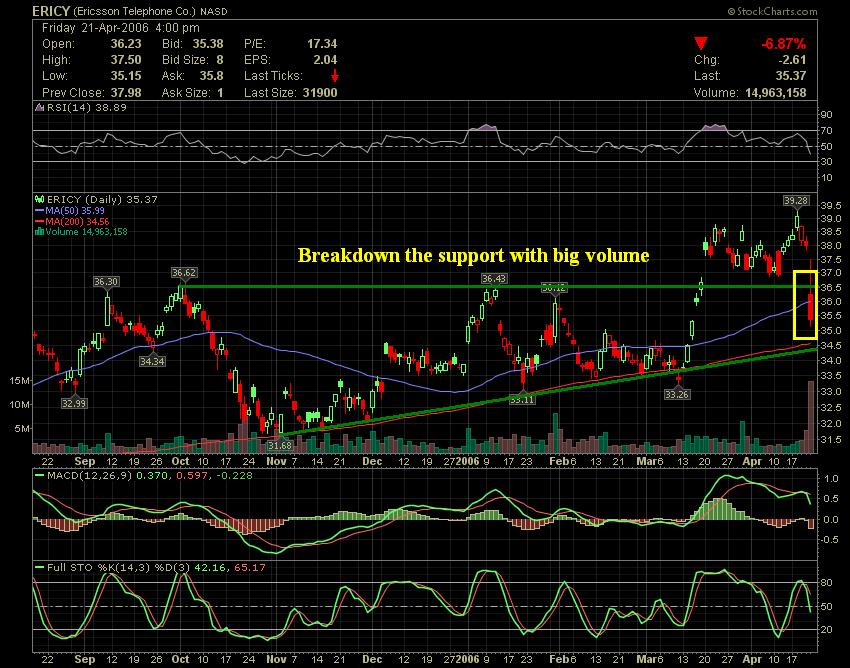
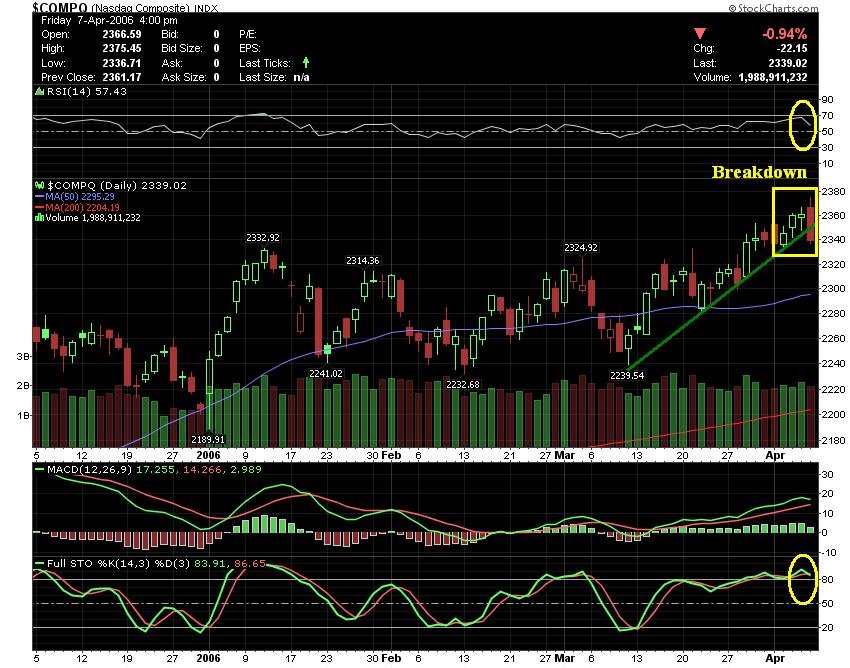
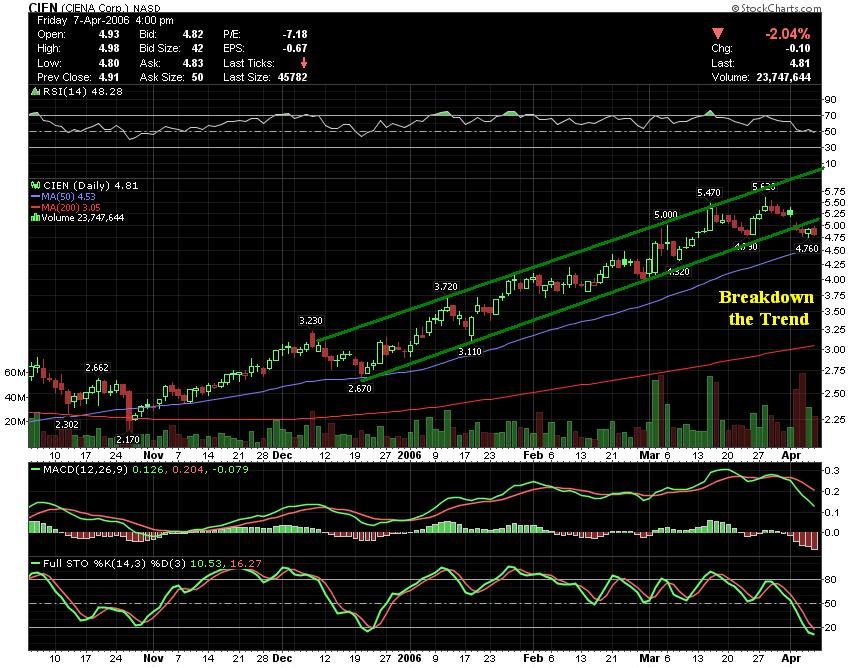
According to chart above we can see that the stock breakout the short downtrend line yesterday, but after reported earnings the stock bounce back and closed under LT.
According to chart above we can see that the stock breakout the short downtrend line yesterday, but after reported earnings the stock bounce back and closed under LT.
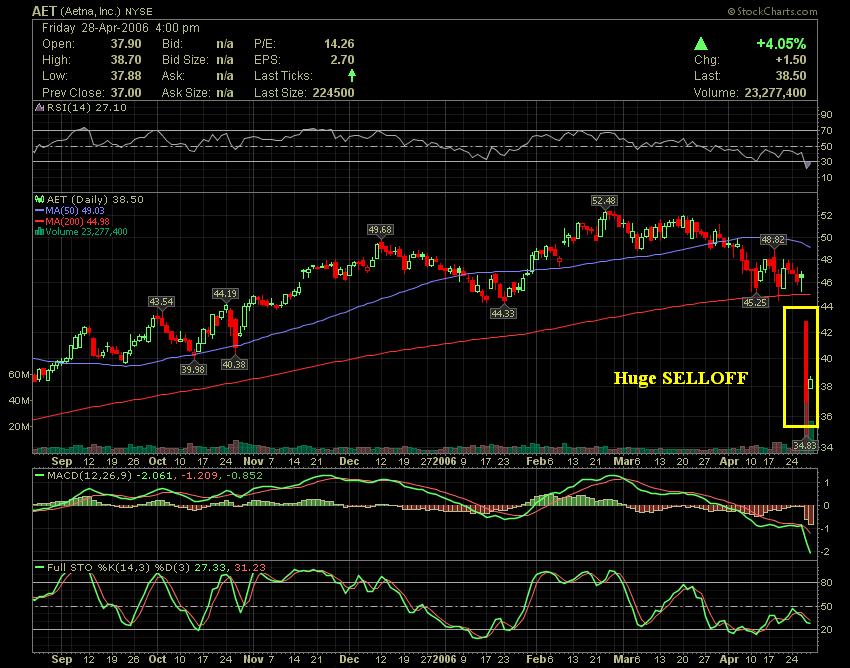 Chart courtesy of stockcharts
AETNA ( AET stock ) fell more than 20% on Thursday after the company reported strong earnings, but announced the retirement of two key executives and revealed that a computer with sensitive customer information was stolen, reasons that have pressured the stock.
 Chart courtesy of stockcharts
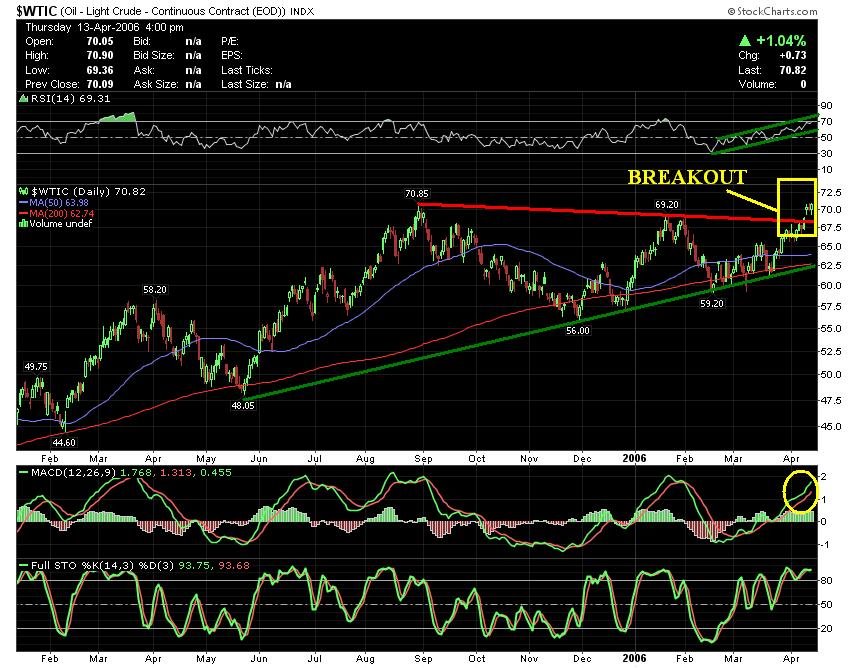
Lam Research Corporation stock breakout yesterday the big resistance at 48.57 on higher volume and have tested today the breakout point with sucess, closing above this level at 48.88.
According to chart above the indicators still showing Bullishs signals.
Friday hot stocks in after-hours : XLB , NWL , WIBC ,
Next week will be another big week of earnings May 1st-5th some stocks that will report:
Monday : GVHR, HERO, HUM, NOVN, SYY, TSN, KAR, ALO, CHK, DLLR, EPEX, FSH, FCN, BGC, GW, NCOG, PKY, PDII, PLAY, PPS, PL, PFG, SRX, TSRA, TXRH
Tuesday : ARJ, ADM, BWNG, CMX, CHTR, CKP, RRD, DUK, ECLP, EFJI, EMR, ETR, EOP, EVVV, SINT, SIRI, SHOO, TXU, UTHR, VZ, VSH, LNC, OKI, OPEN, OSUR, WMS
Wednesday : ARTC, BEC, CI, CCU, CCO, CLX, EQR, FBN, GMR, LM, NRP, Q, SBGI, SKYW, ABX, CBT, CECO, ERTS, EXPD, JDSU, MSSR, QLGC, SUN, SPSX, TRLG, WFMI
Thursday : ACW, AXCA, DRL, COG, DJO, EK, ELN, ITWO, INCY, NRGY, MVL, PMI, RHB, SLXP, STRA, TYC, UBLBI, VRX, BKHM, CAMD, CALL, GMST, RMD, UVN
Friday : ACET, CACH, FS, GMRK, LOJN, MHS, MCCC, THQI, TOL, WMG CRK, POM
That's All, Have a great weekend !!!
AC
| Permalink | ![]()